A fact-based, easy-to-understand guide for interpreting every section of the report — covering stocks, ETFs, and the earnings calendar.
What Is This Tool?
This tool helps you research stocks (shares in a company) and ETFs (exchange-traded funds — baskets of stocks you can buy as one) before deciding whether they might be a good investment. It pulls real financial data and organizes it into easy-to-read sections.
You can also browse an Earnings Calendar to see when the biggest companies are reporting their quarterly results, with AI-powered previews of what to watch for each one.
Important: This tool does NOT tell you what to do. It gives you information so YOU can make a smarter decision.
Other Tools
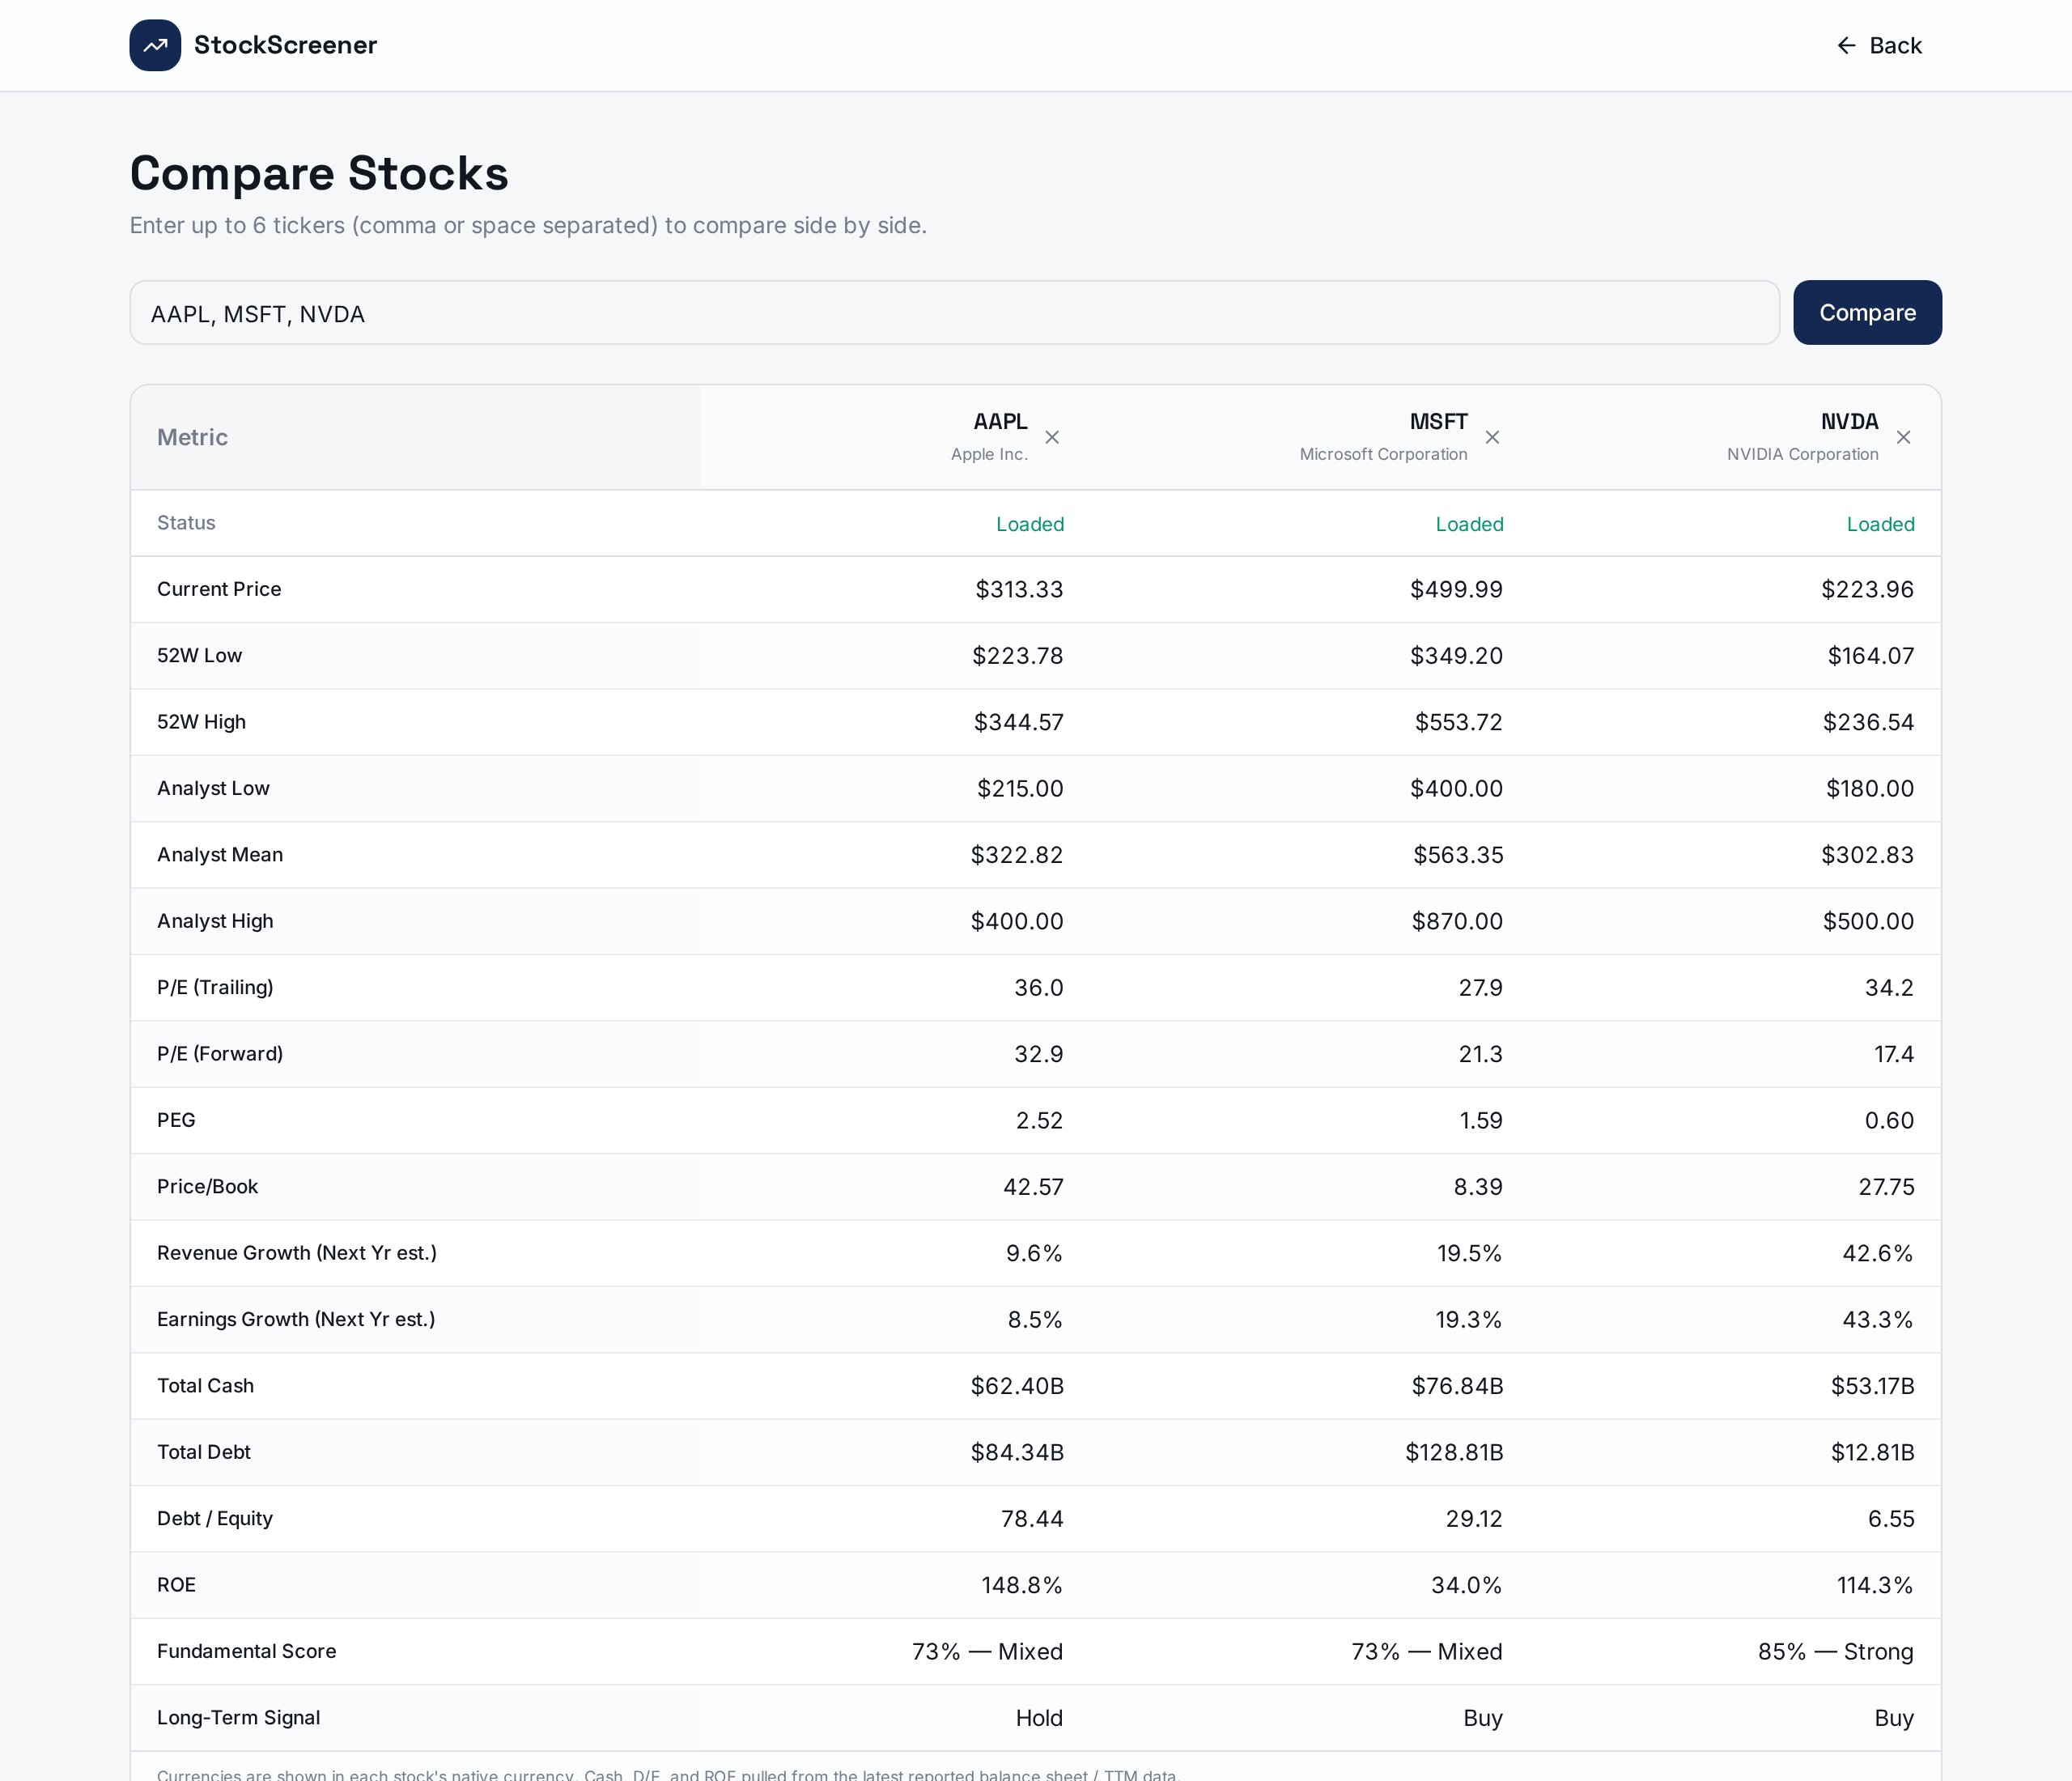
Compare — Side-by-side comparison of up to 6 tickers across price, 52-week range, analyst targets (low / mean / high), trailing & forward P/E, PEG, estimated revenue & earnings growth, cash, debt-to-equity, and ROE. Ideal for shortlisting which names deserve a deeper analysis.
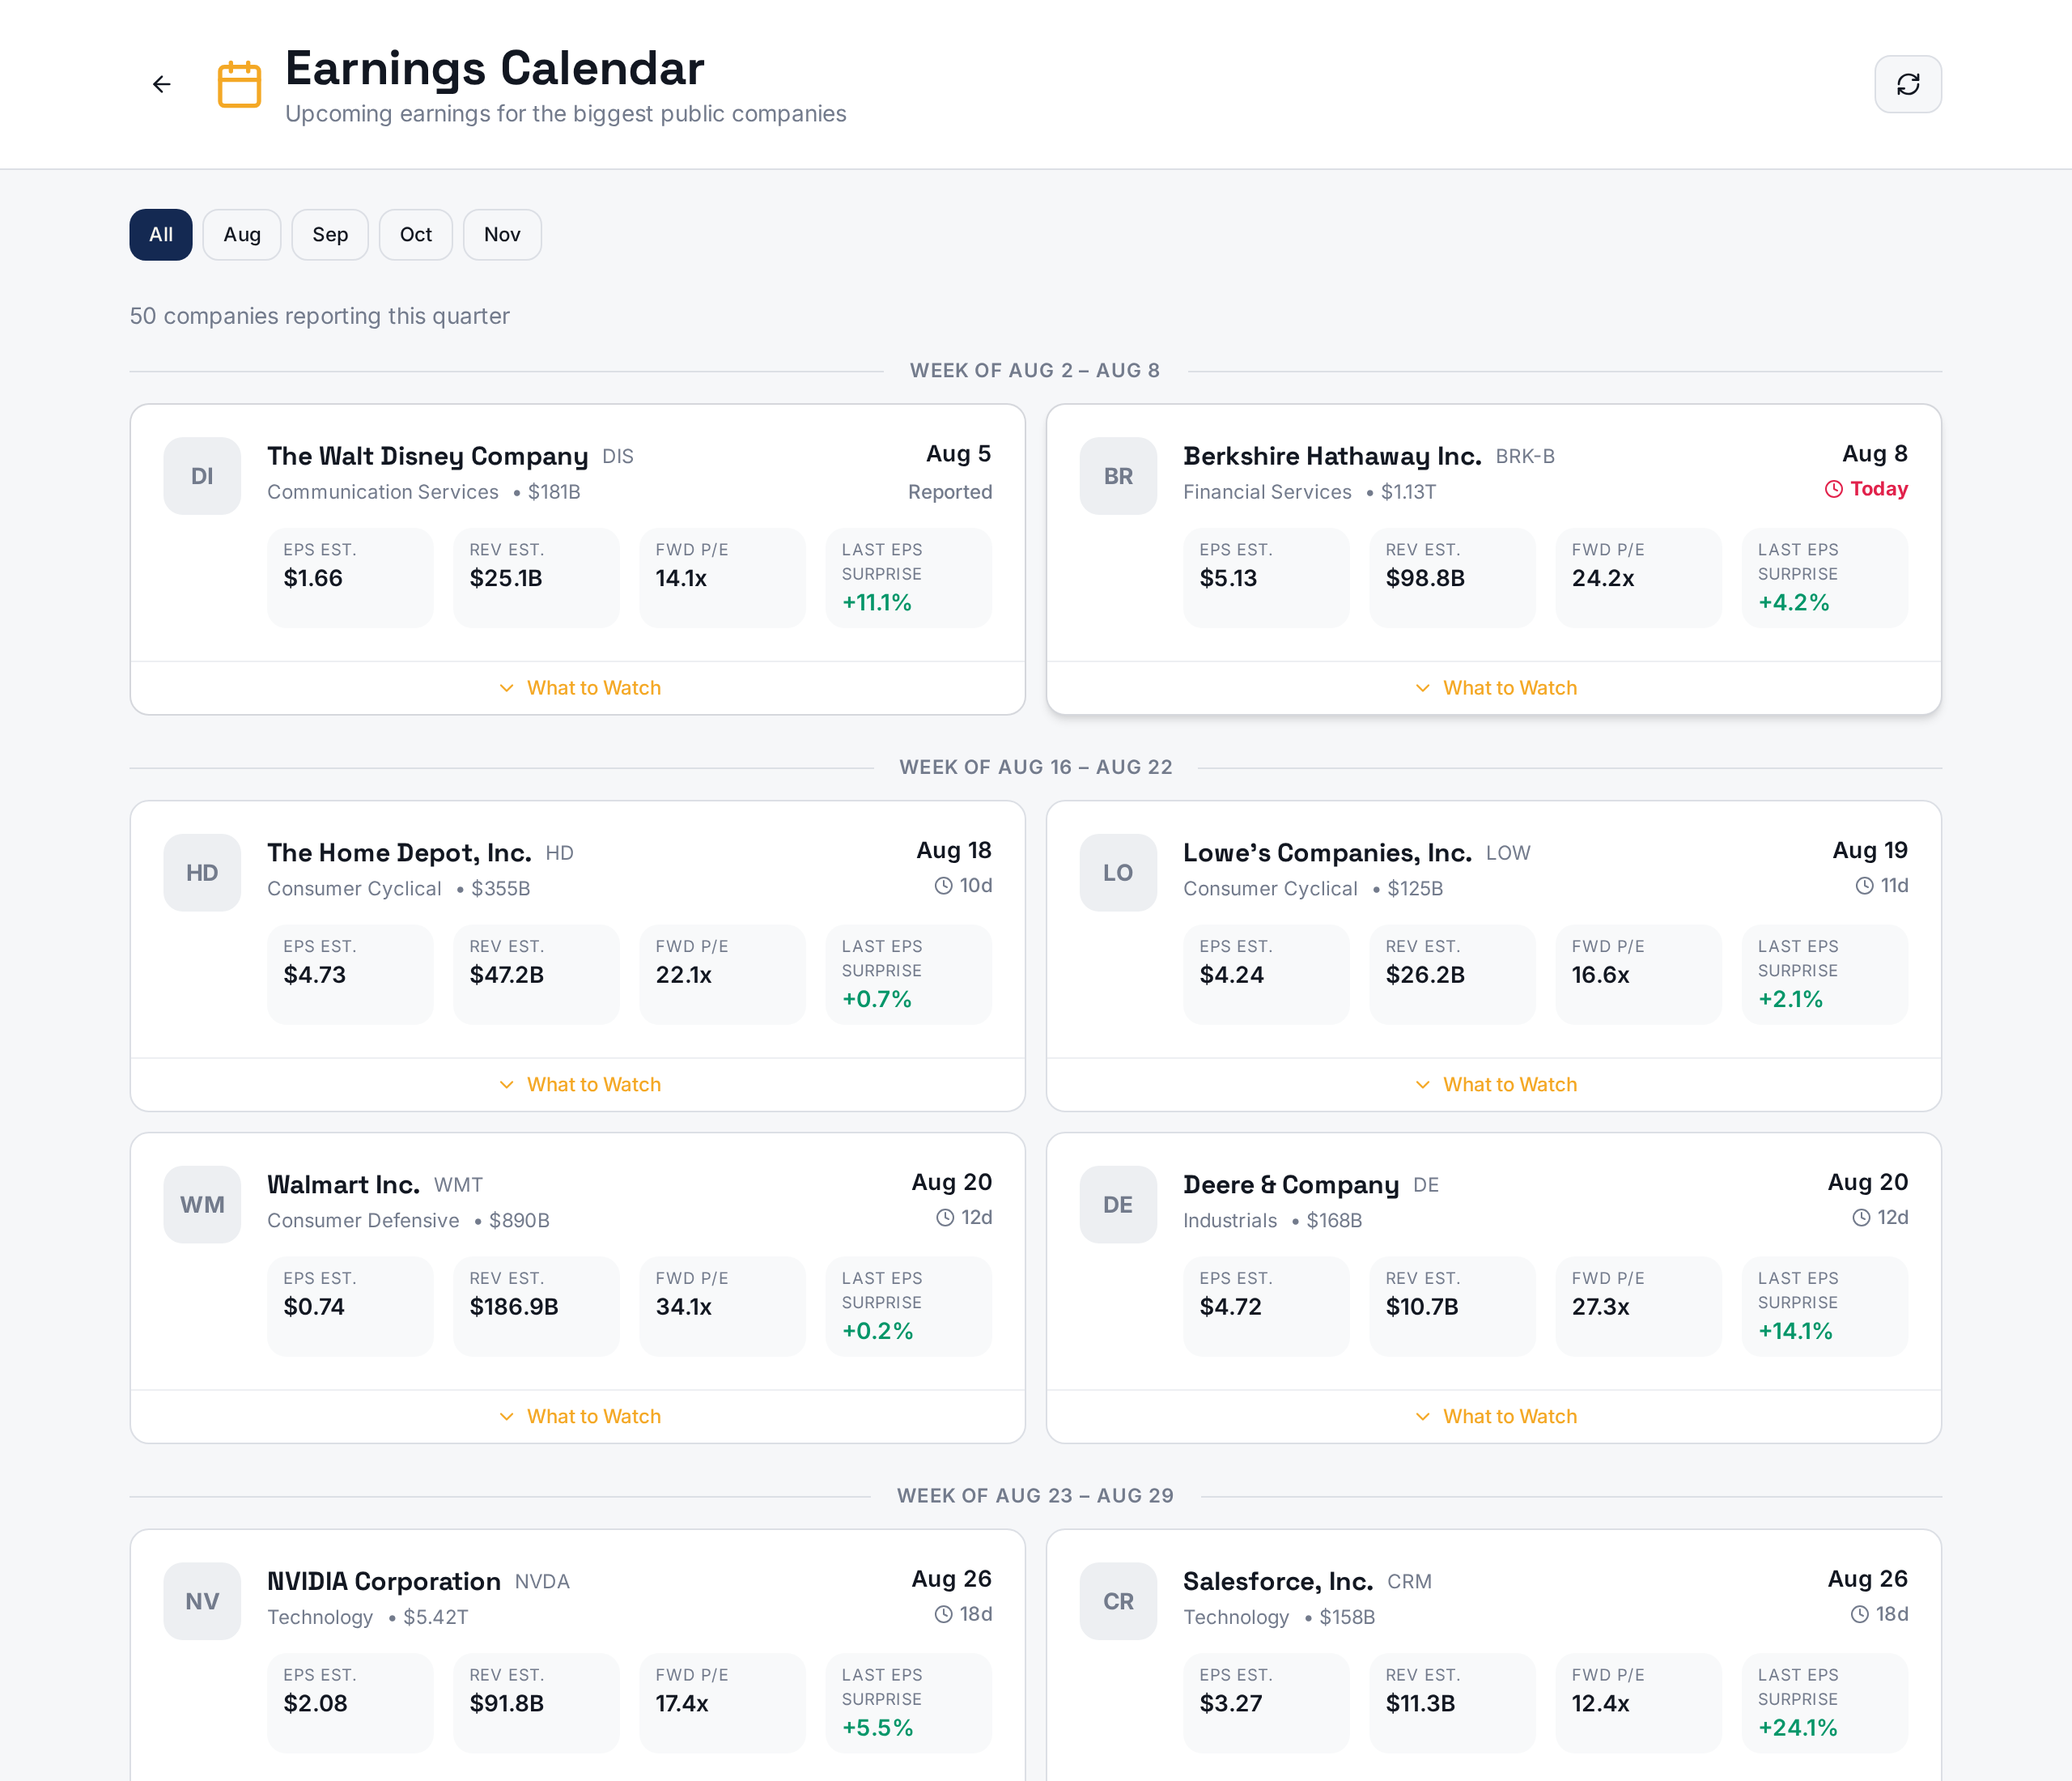
Earnings Calendar — Upcoming earnings with AI-powered "What to Watch" previews.
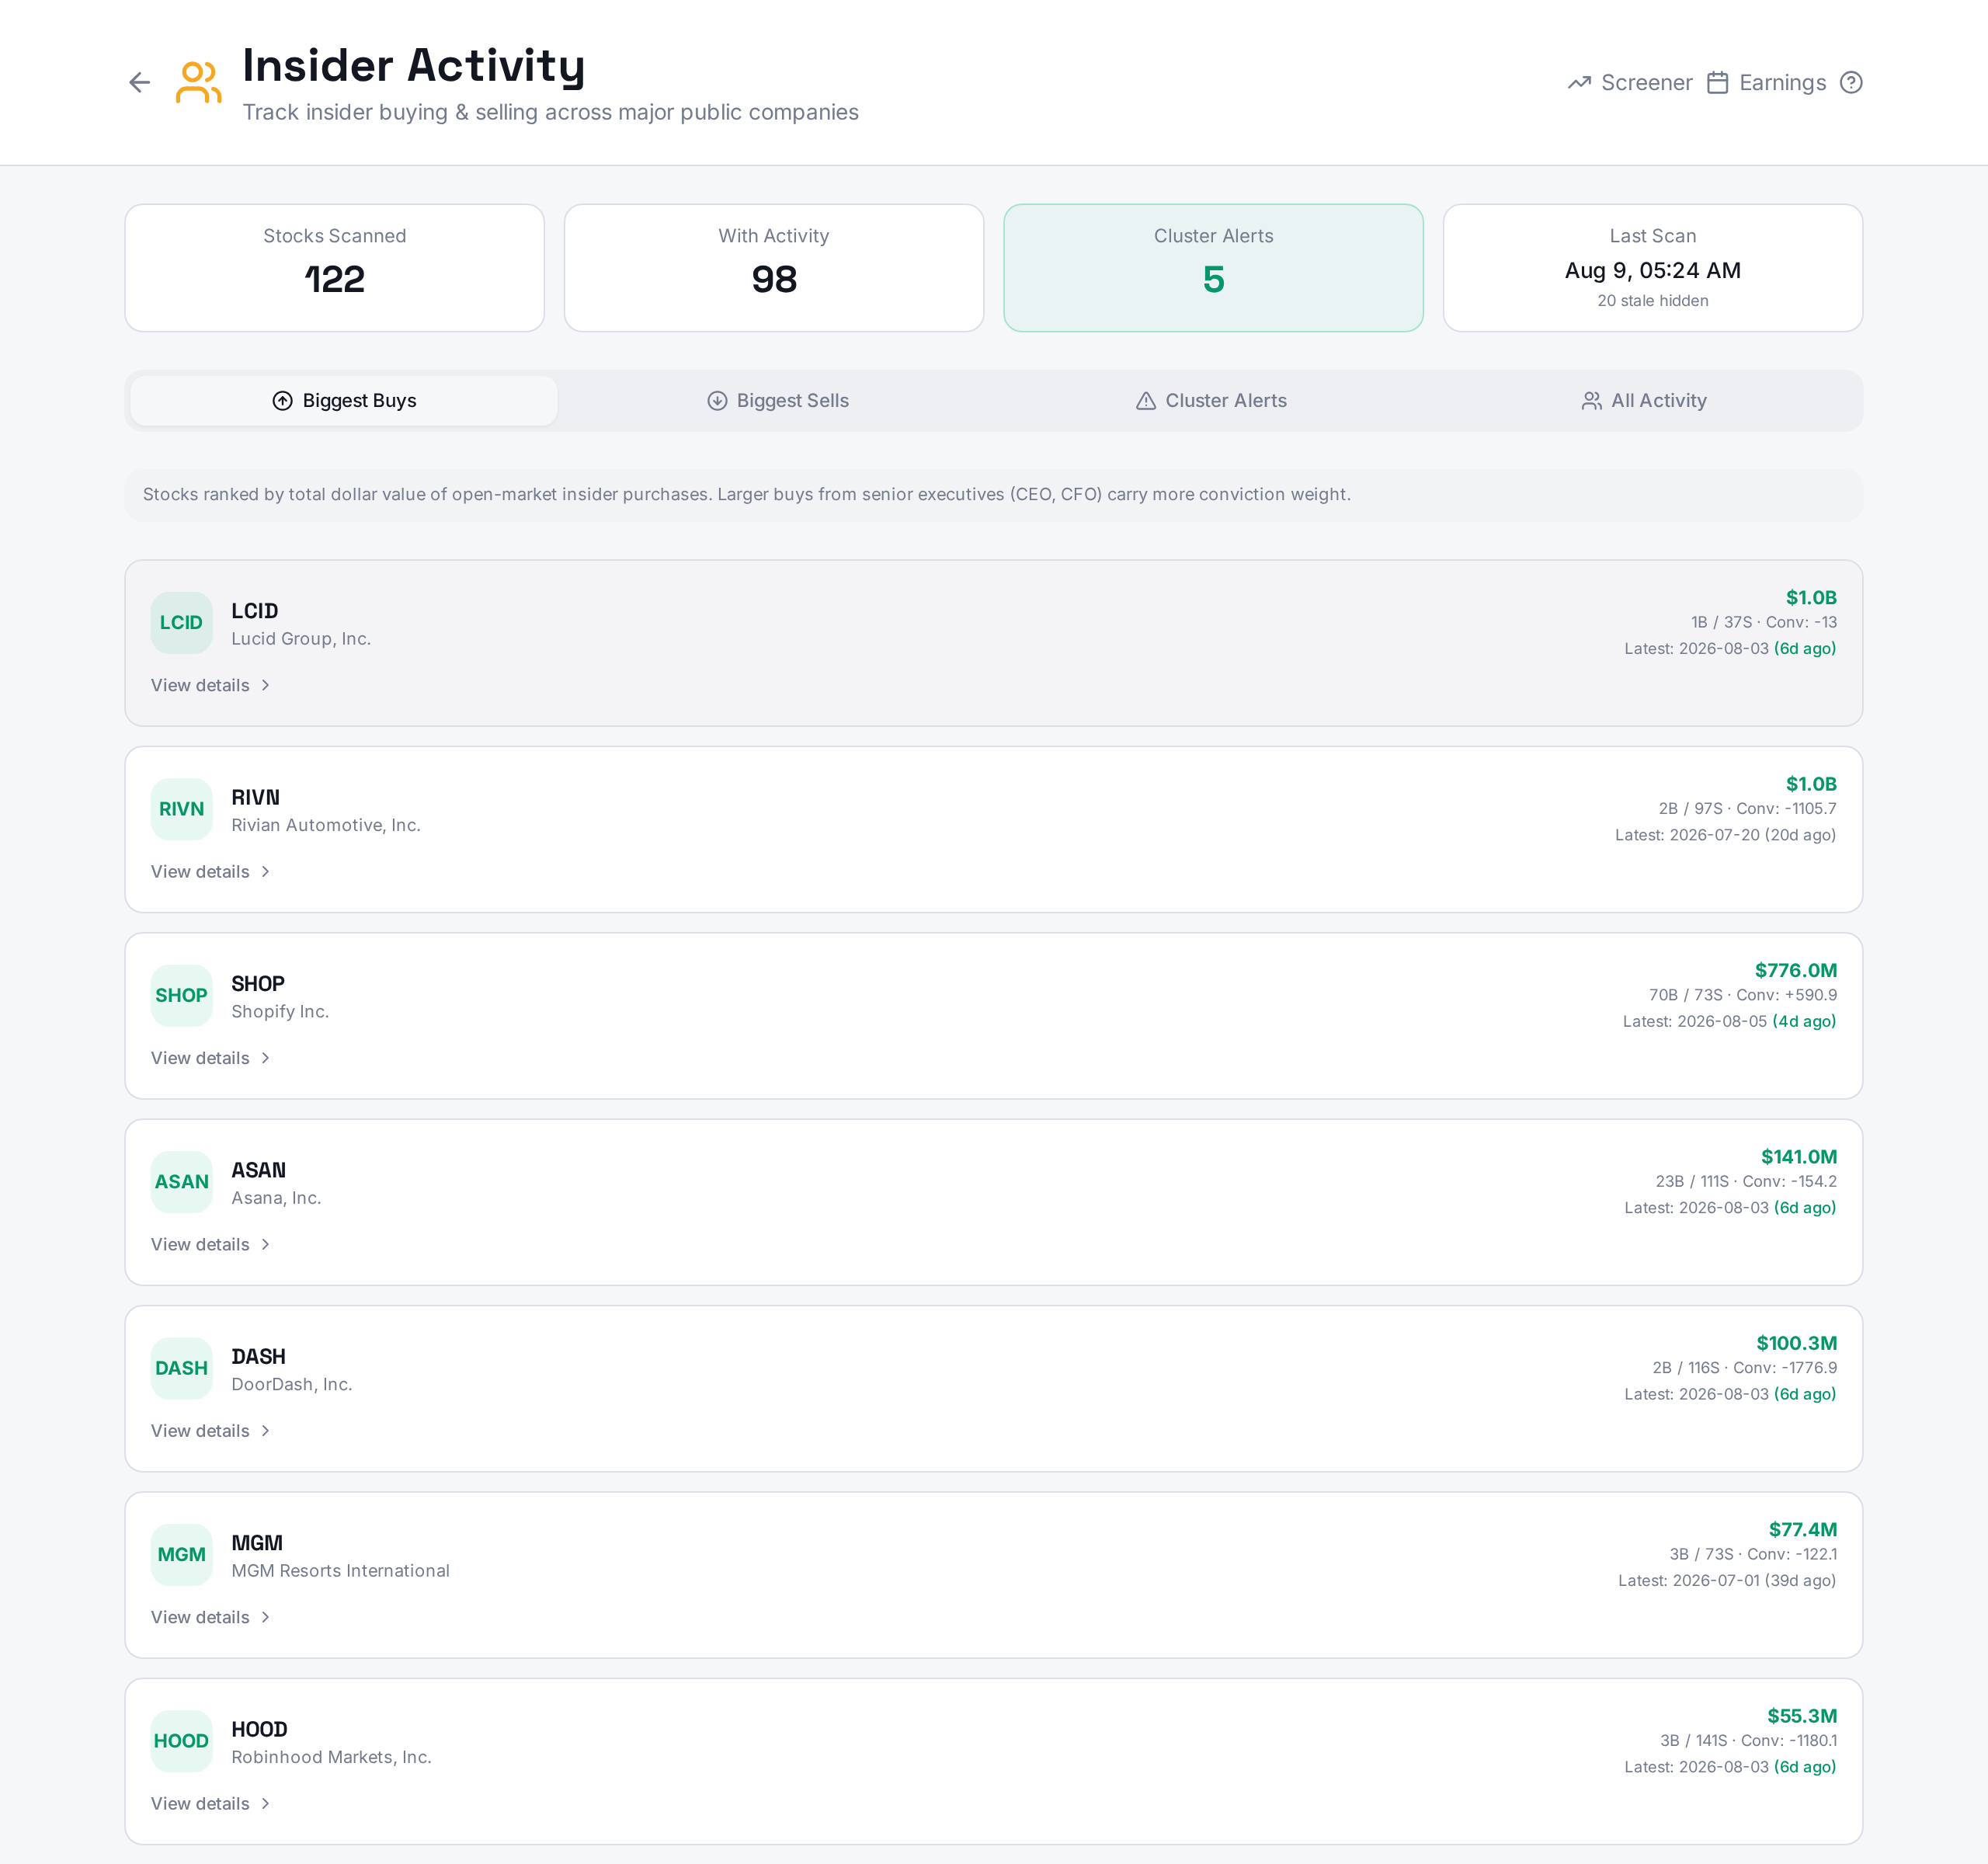
Insider Activity — Market-wide scanner for the biggest insider buys, sells, and cluster trades.
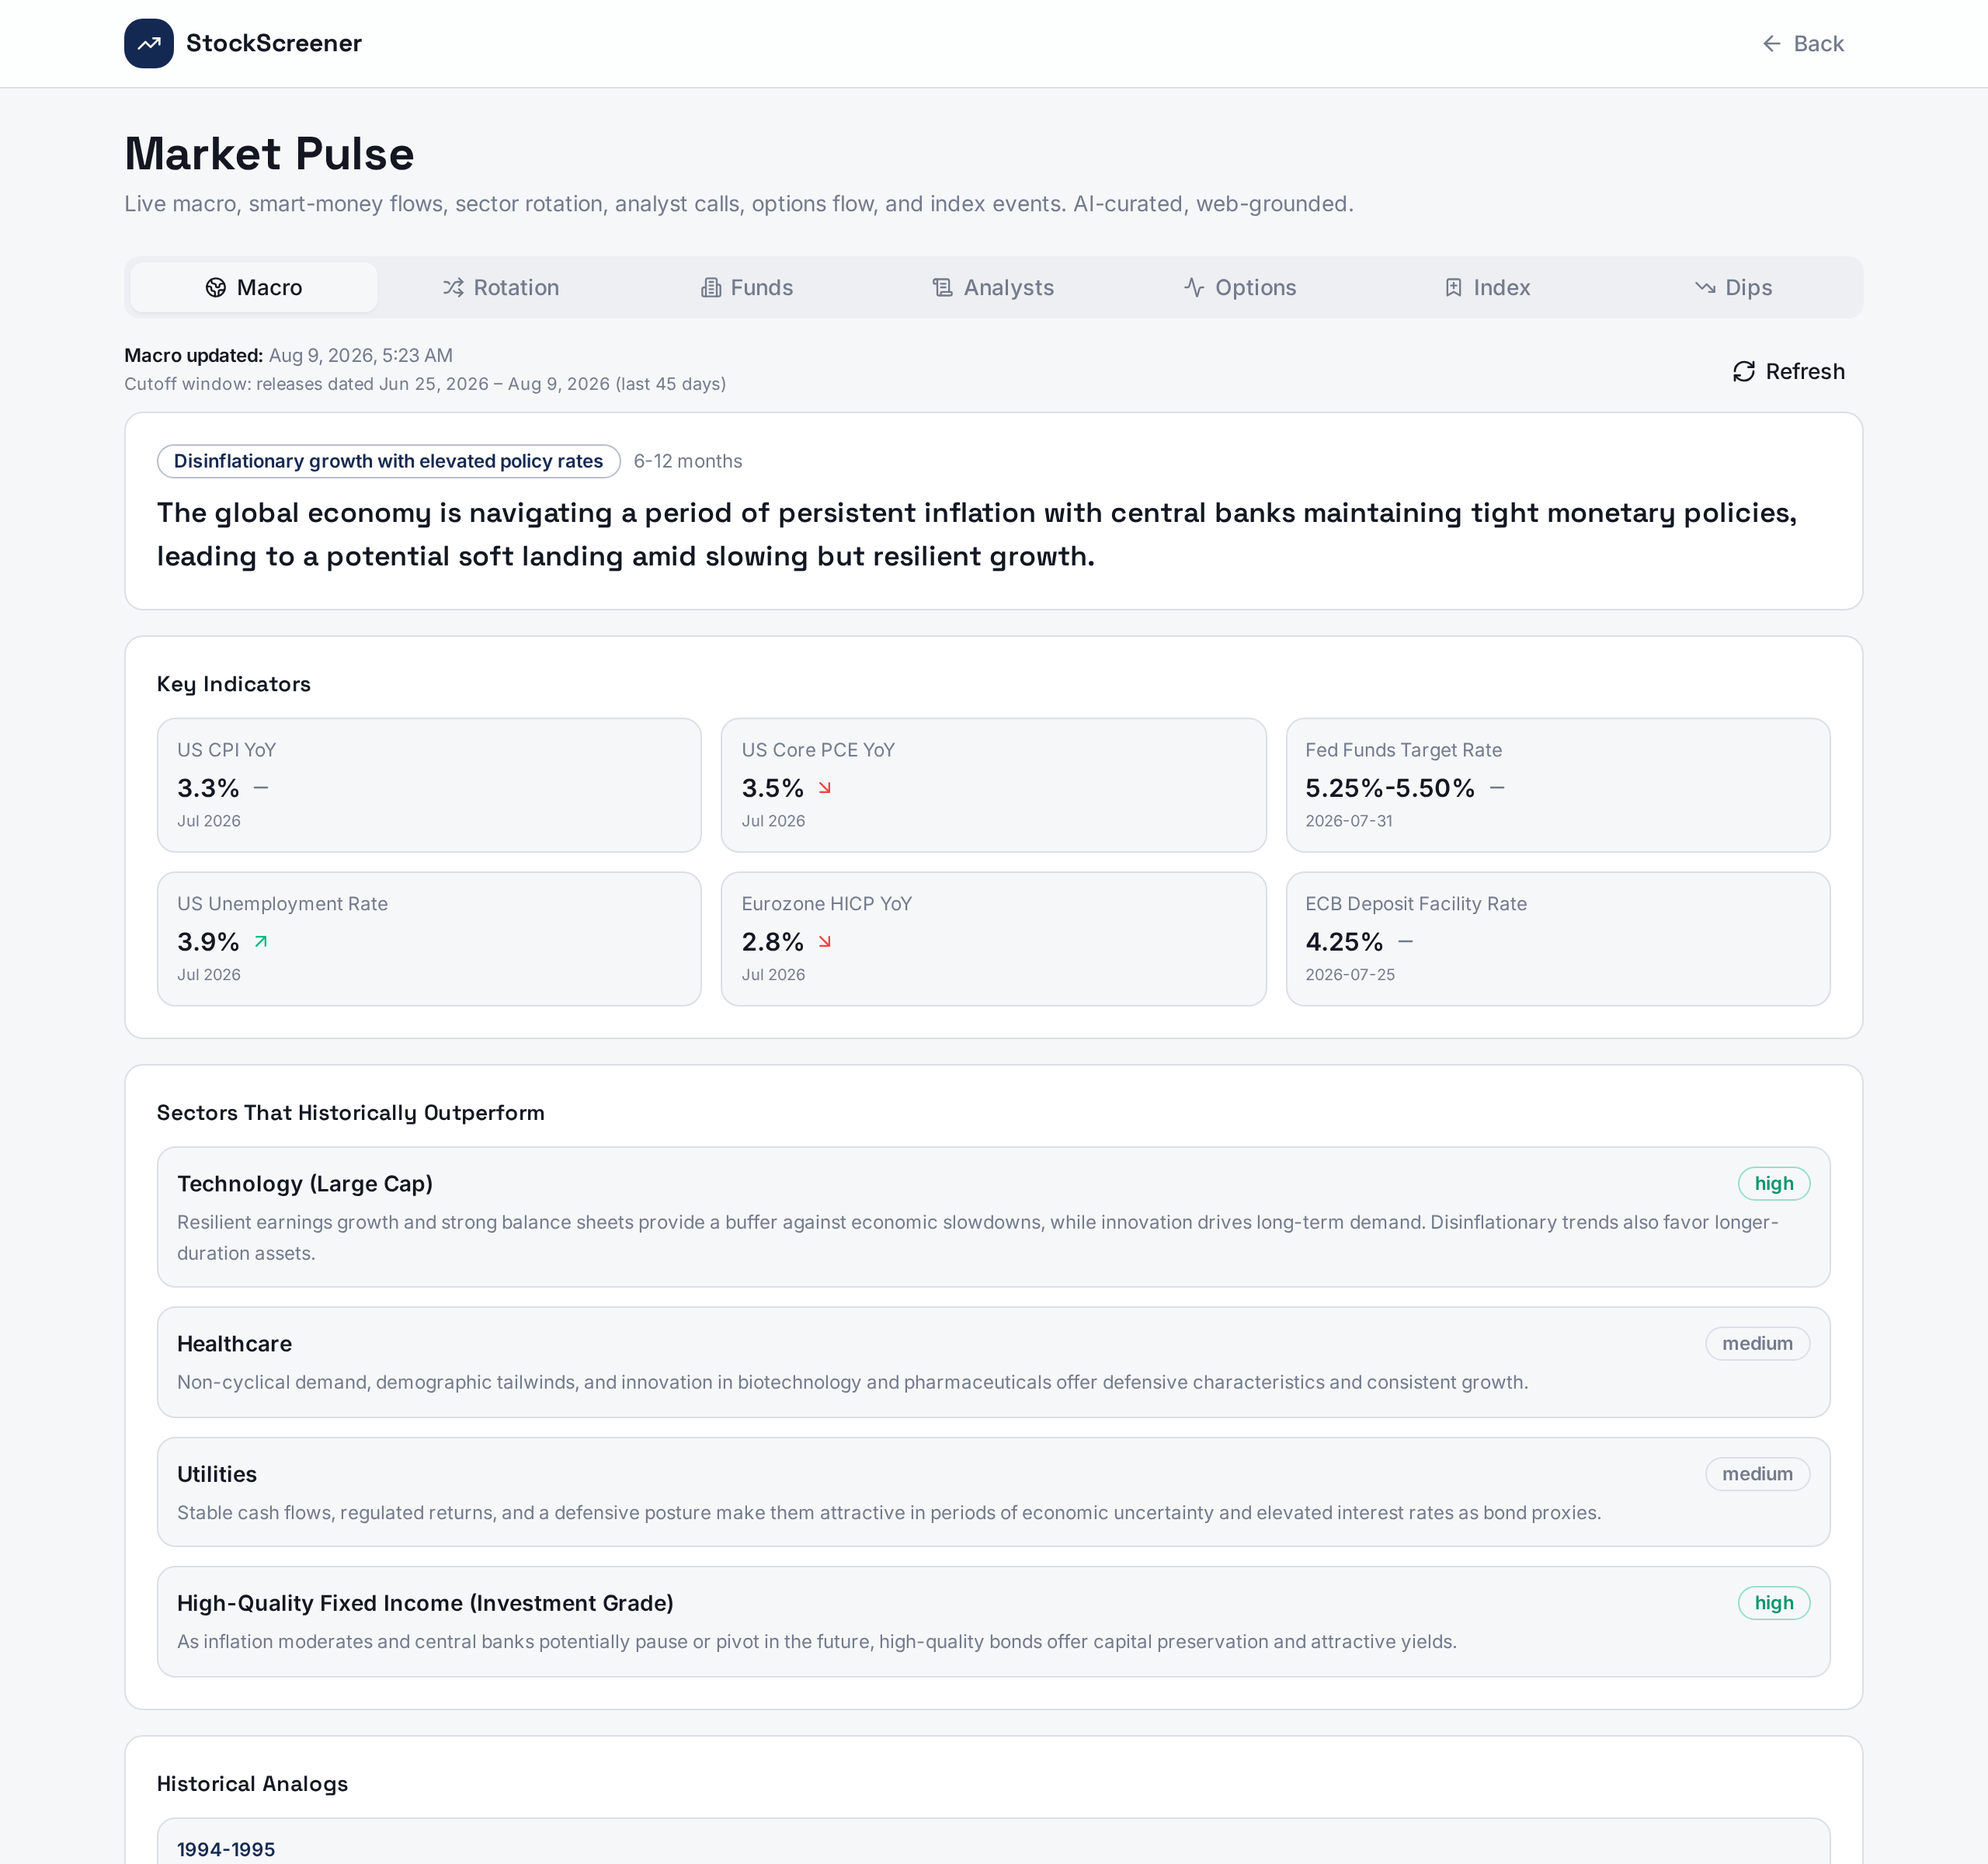
Market Pulse — A macro snapshot (rates, indices, breadth, sentiment). Reachable directly at /market-pulse.
Step 1: Search for a Stock or ETF
Type a ticker symbol or company/fund name into the search bar. The tool automatically detects whether your search is a stock or an ETF and loads the appropriate analysis. Examples:
AAPL or Apple → Stock analysis
MSFT or Microsoft → Stock analysis
SPY → ETF analysis (S&P 500 tracker)
VOO or QQQ → ETF analysis
IBIT or BTCW → ETF analysis (Bitcoin ETFs)
If the company trades on a non-US exchange, you may need a suffix (e.g., SAP.DE for SAP in Germany).
Tip: You can type full company names like "Microsoft" or "Tesla" — the tool will resolve them to the correct ticker automatically.
Stock Analysis
A stock report reads top to bottom like a story: what you are looking at, what the numbers say, and then the detail behind it.
The header — price, fair value and 52-week range
Current price (with currency), fair value and margin of safety, plus where the price sits in its 52-week range.
Price — the latest quote, always shown in the stock's own currency.
Our fair-value estimate — what our own model thinks the business is worth today at normal multiples, with the gap to the current price beside it (positive = trading below it, negative = trading above it). This is a model estimate, shown as a cross-check.
Wall Street 12-month target — the headline forward number: the consensus analyst price target. The summary consistently uses this analyst target for its upside/downside so you are never shown two conflicting figures.
52W Range — the dot shows how close the price is to its 12-month low or high.
Two different lenses: our fair-value estimate is intrinsic (what the business is worth) and the analyst target is a 12-month price expectation. They can disagree — the summary leads with the analyst target for consistency, and keeps fair value as a labelled cross-check.
Price Outlook — where the price could go
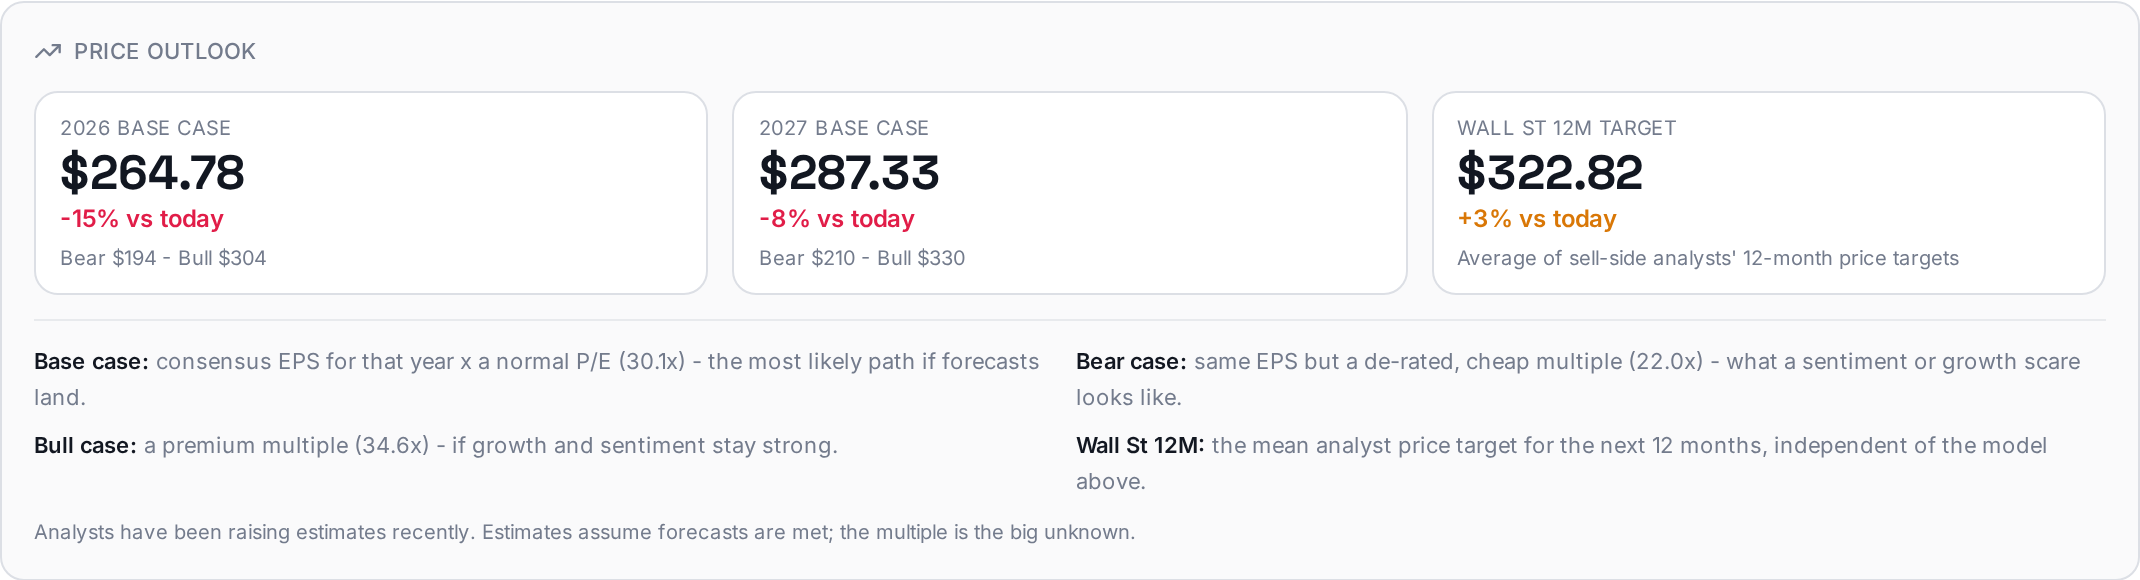
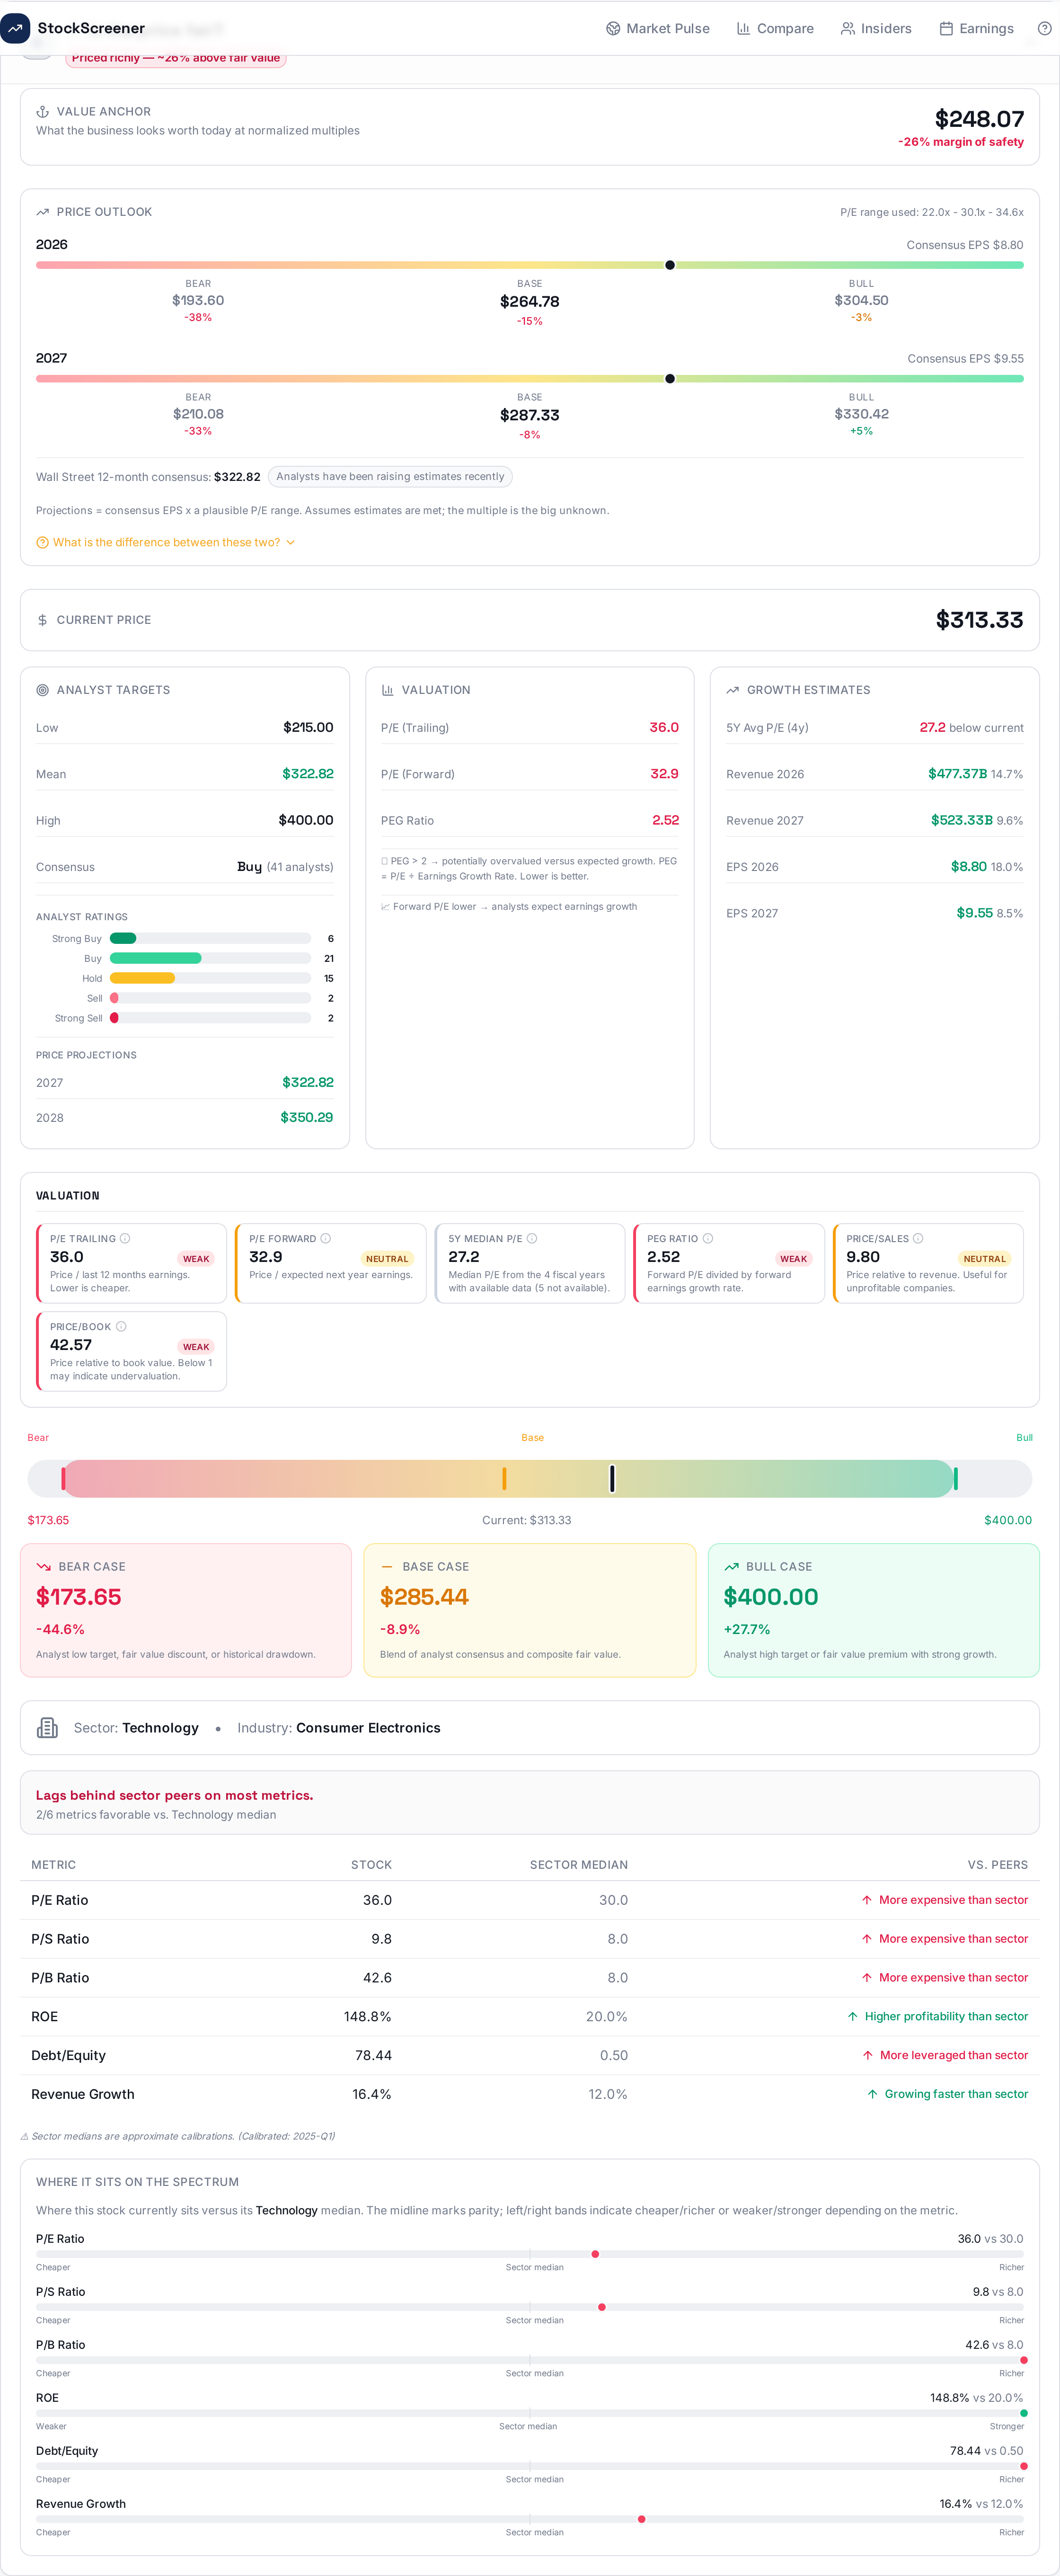
Base case per forecast year, the bear-bull range, and the analyst consensus target.
Base case — consensus earnings per share (EPS) for that fiscal year multiplied by a normal price/earnings (P/E) multiple. The most likely path if forecasts land.
Bear case — same EPS, but a cheap, de-rated multiple: what a sentiment or growth scare looks like.
Bull case — a premium multiple, if growth and sentiment stay strong.
Wall St 12M target — the mean price target published by sell-side analysts for the next 12 months. It is independent of the model above, and the % beside it is the upside or downside versus today's price.
The year labels (e.g. 2026, 2027) are fiscal years taken from the estimate period's year-end date, so they may not match the calendar year for companies whose financial year does not end in December.
The Verdict panel
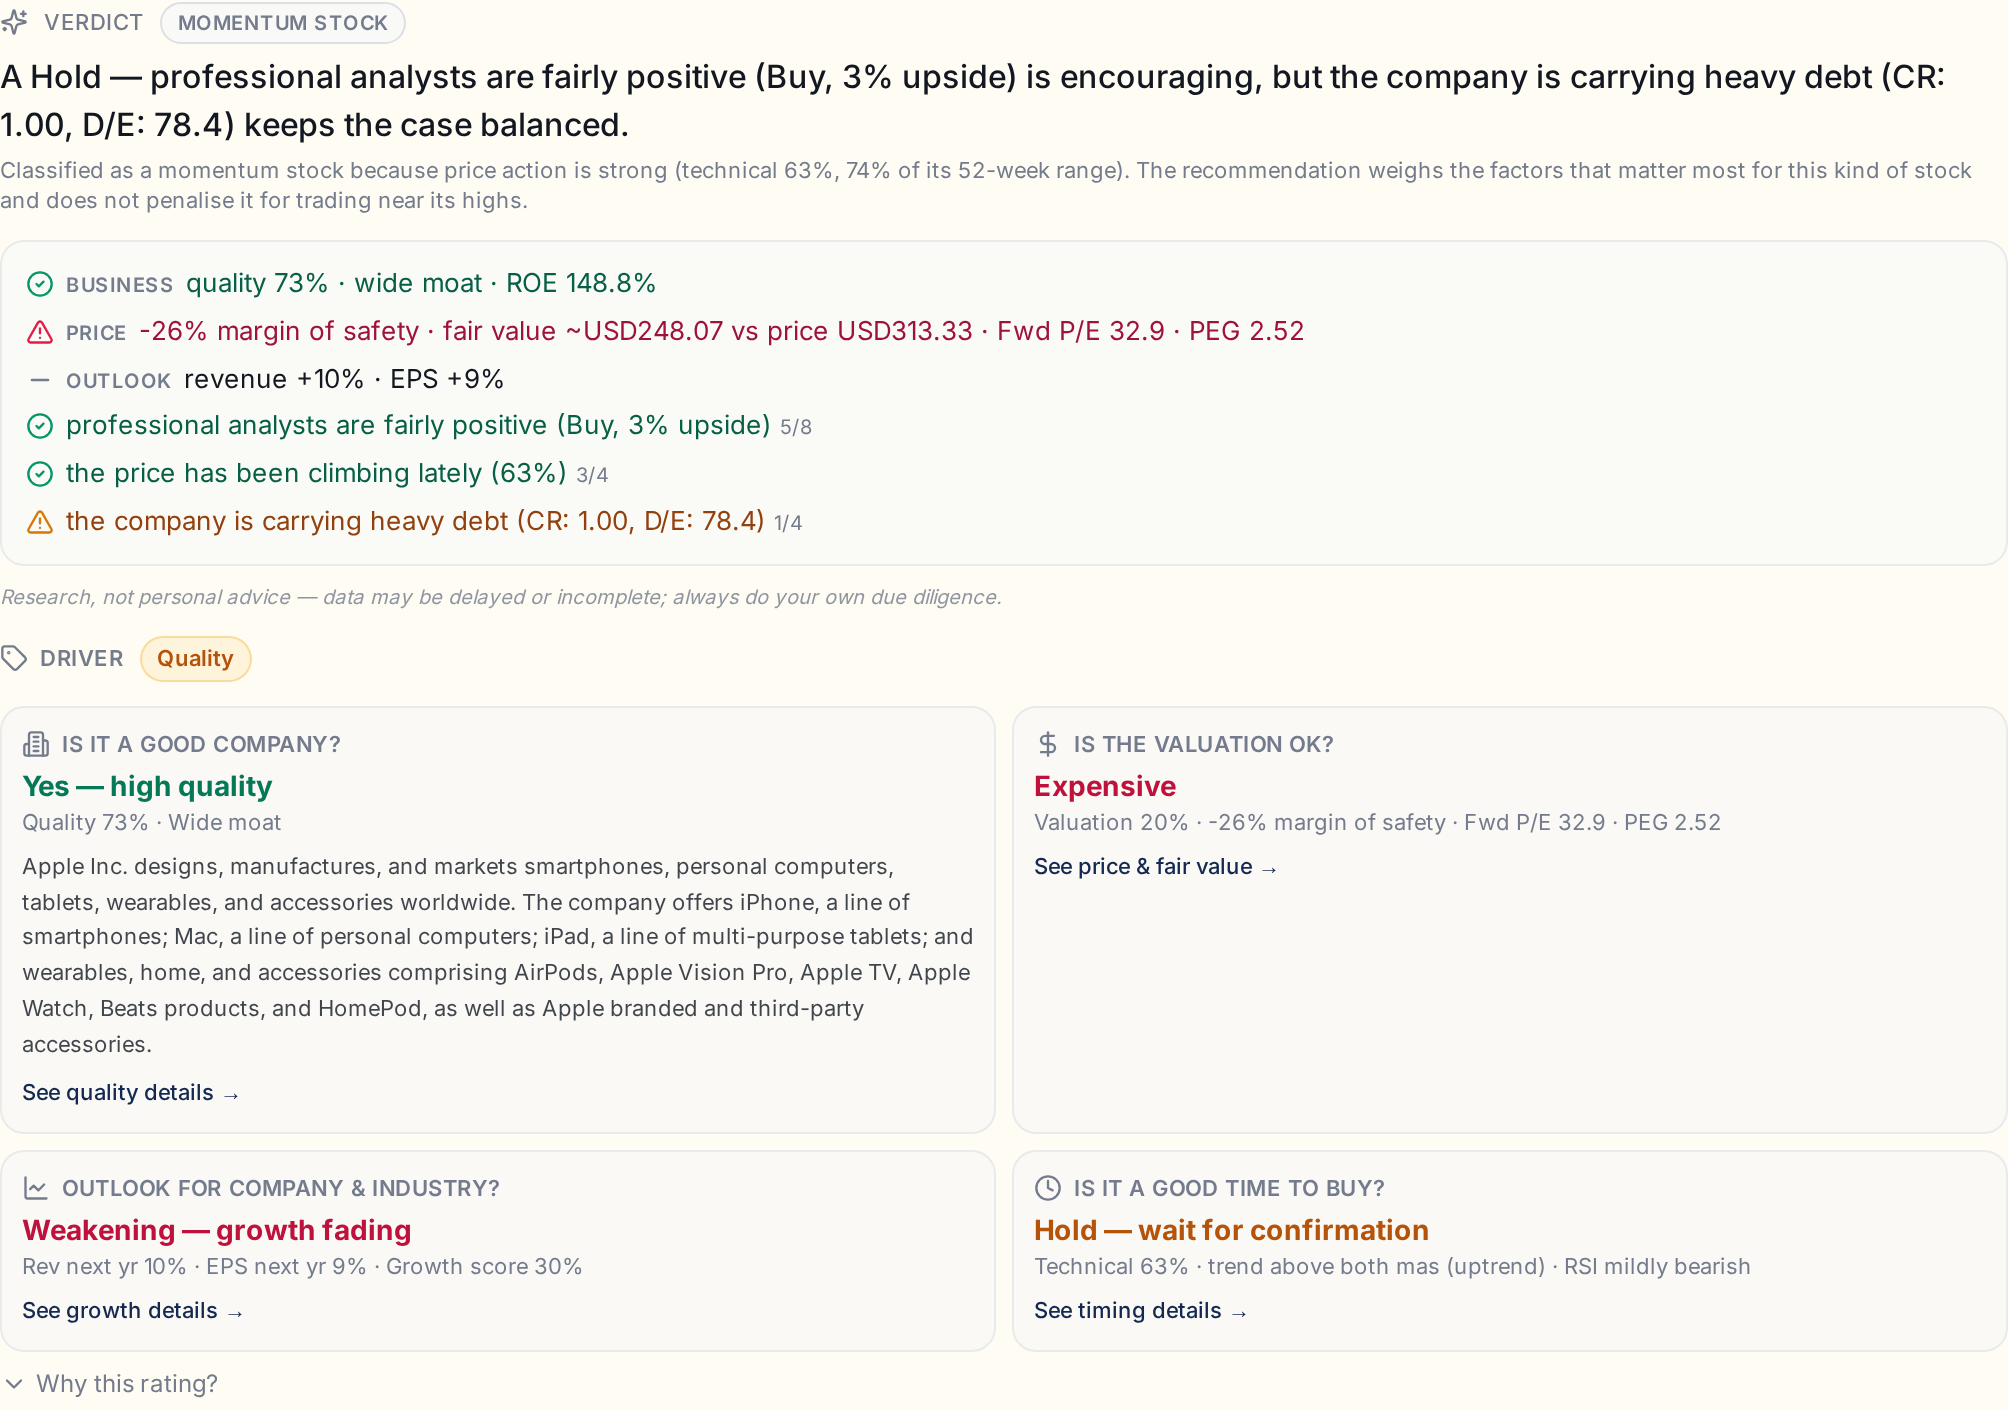
One headline sentence, then colour-coded highlights and the grounded reasons behind the call.
The headline is a plain-English Buy / Hold / Sell framing. Underneath, each bullet is one grounded fact — colour-coded green (supports), amber (mixed) or red (works against) — and the key reasons carry the points score that actually drove the signal, so the words always match the numbers. A profile label — such as Growth stock, Value stock, Defensive quality or Dividend income — describes what kind of business this is.
The label is descriptive, not a thumb on the scale. Every stock is scored with the exact same weighting — the profile label tells you what kind of company it is, but it does not change the Buy / Hold / Sell maths.
The eight sections
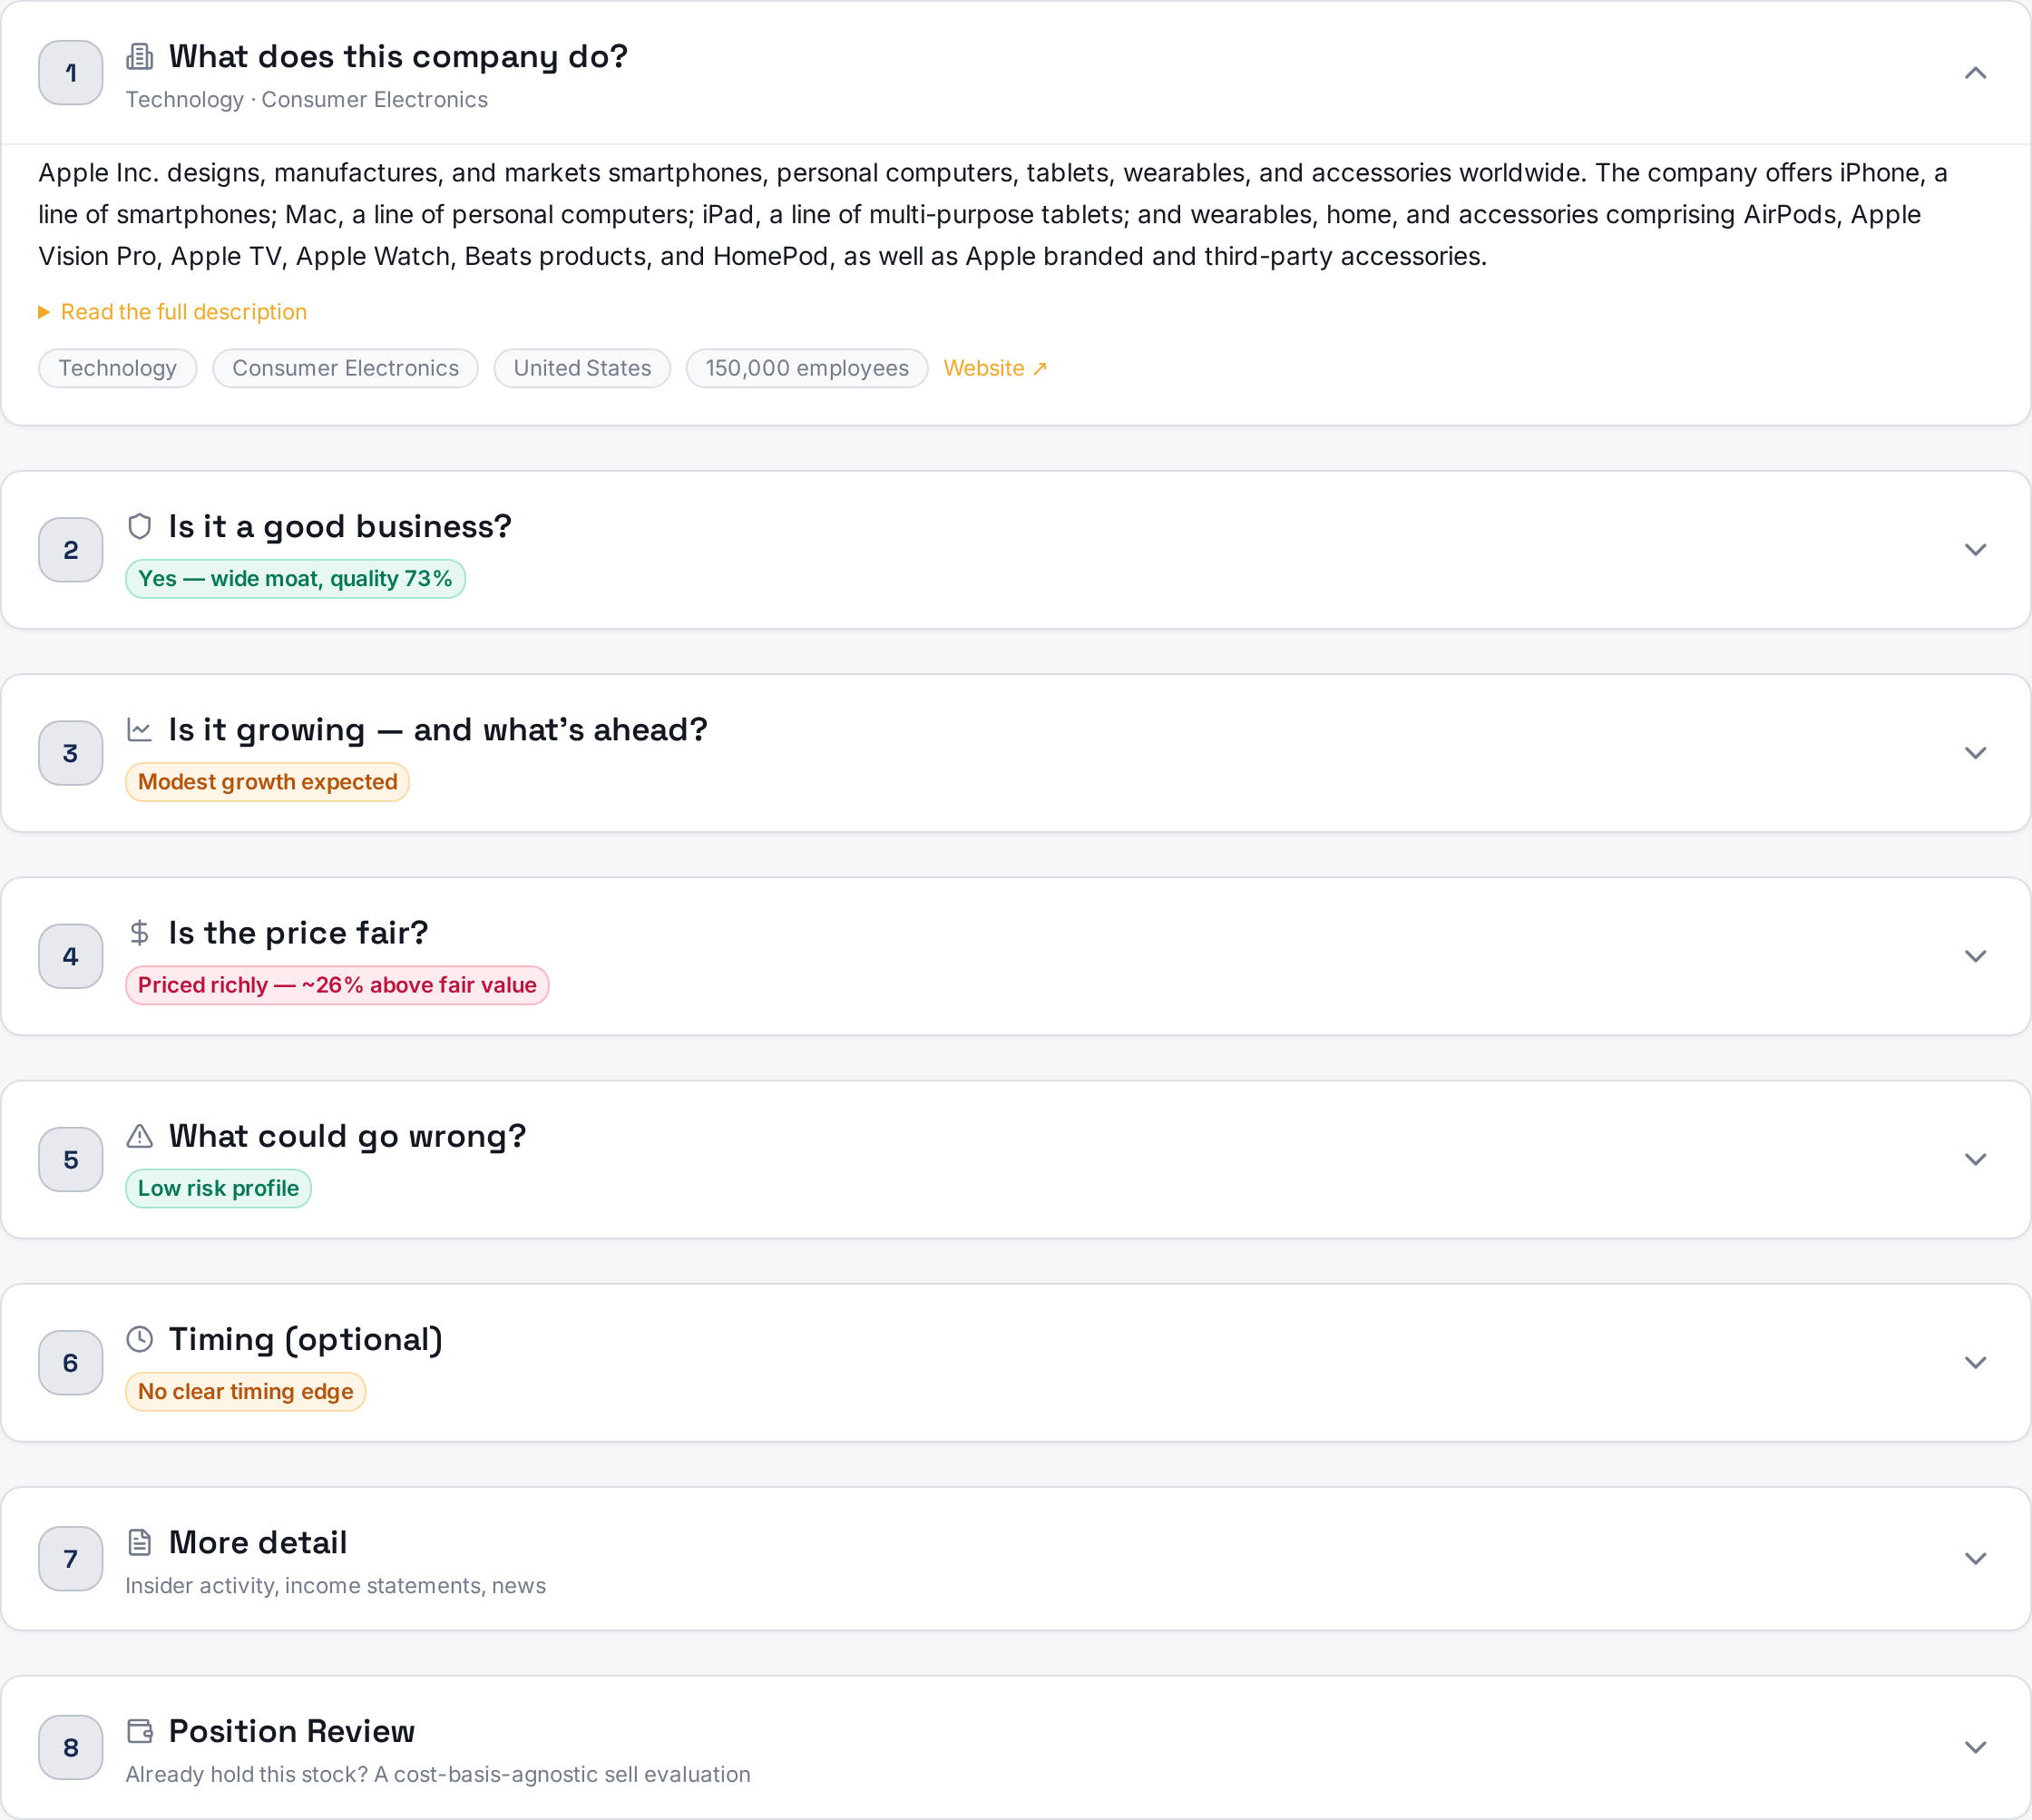
Every section is a question, with its one-line answer visible even when collapsed — so you can read the whole story without expanding anything.
What does this company do? — a plain-English description of the business, sector and industry.
Is it a good business? — quality score, moat, profitability, balance sheet.
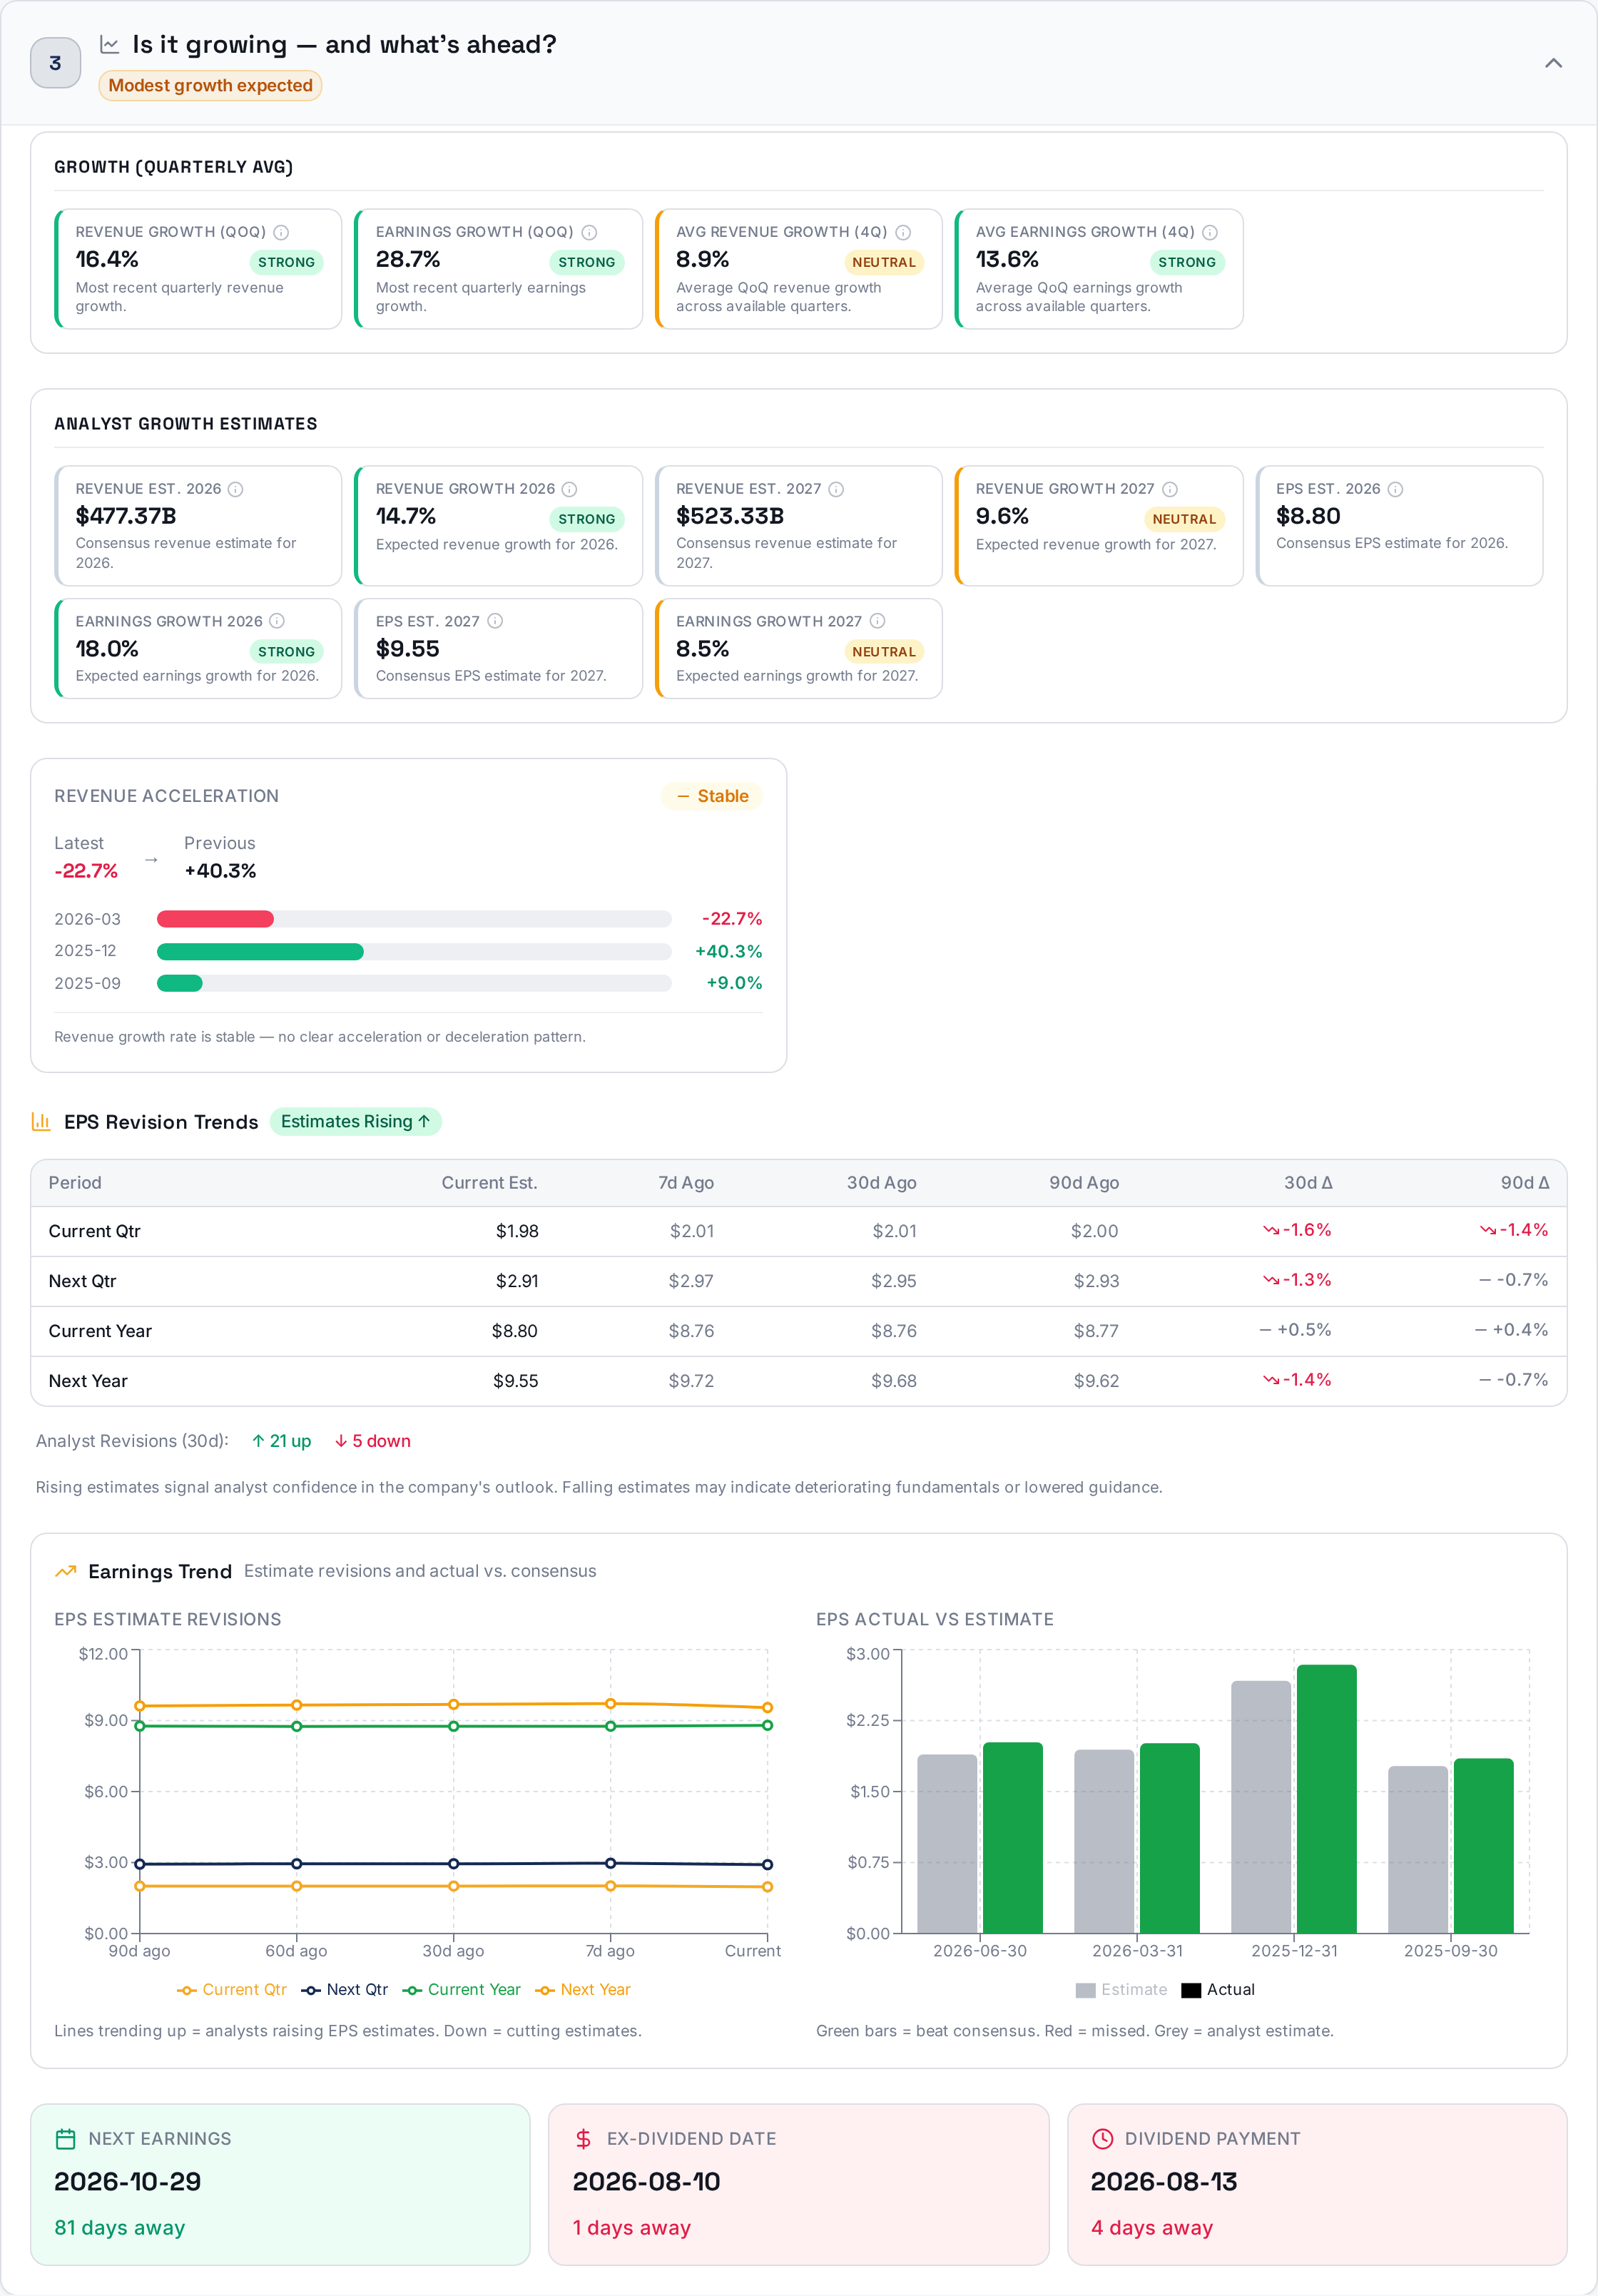
Is it growing — and what's ahead? — revenue and earnings trends, estimate revisions, margin direction, next earnings date.
Is the price fair? — analyst target, fair-value models, multiples, scenarios, peer comparison.
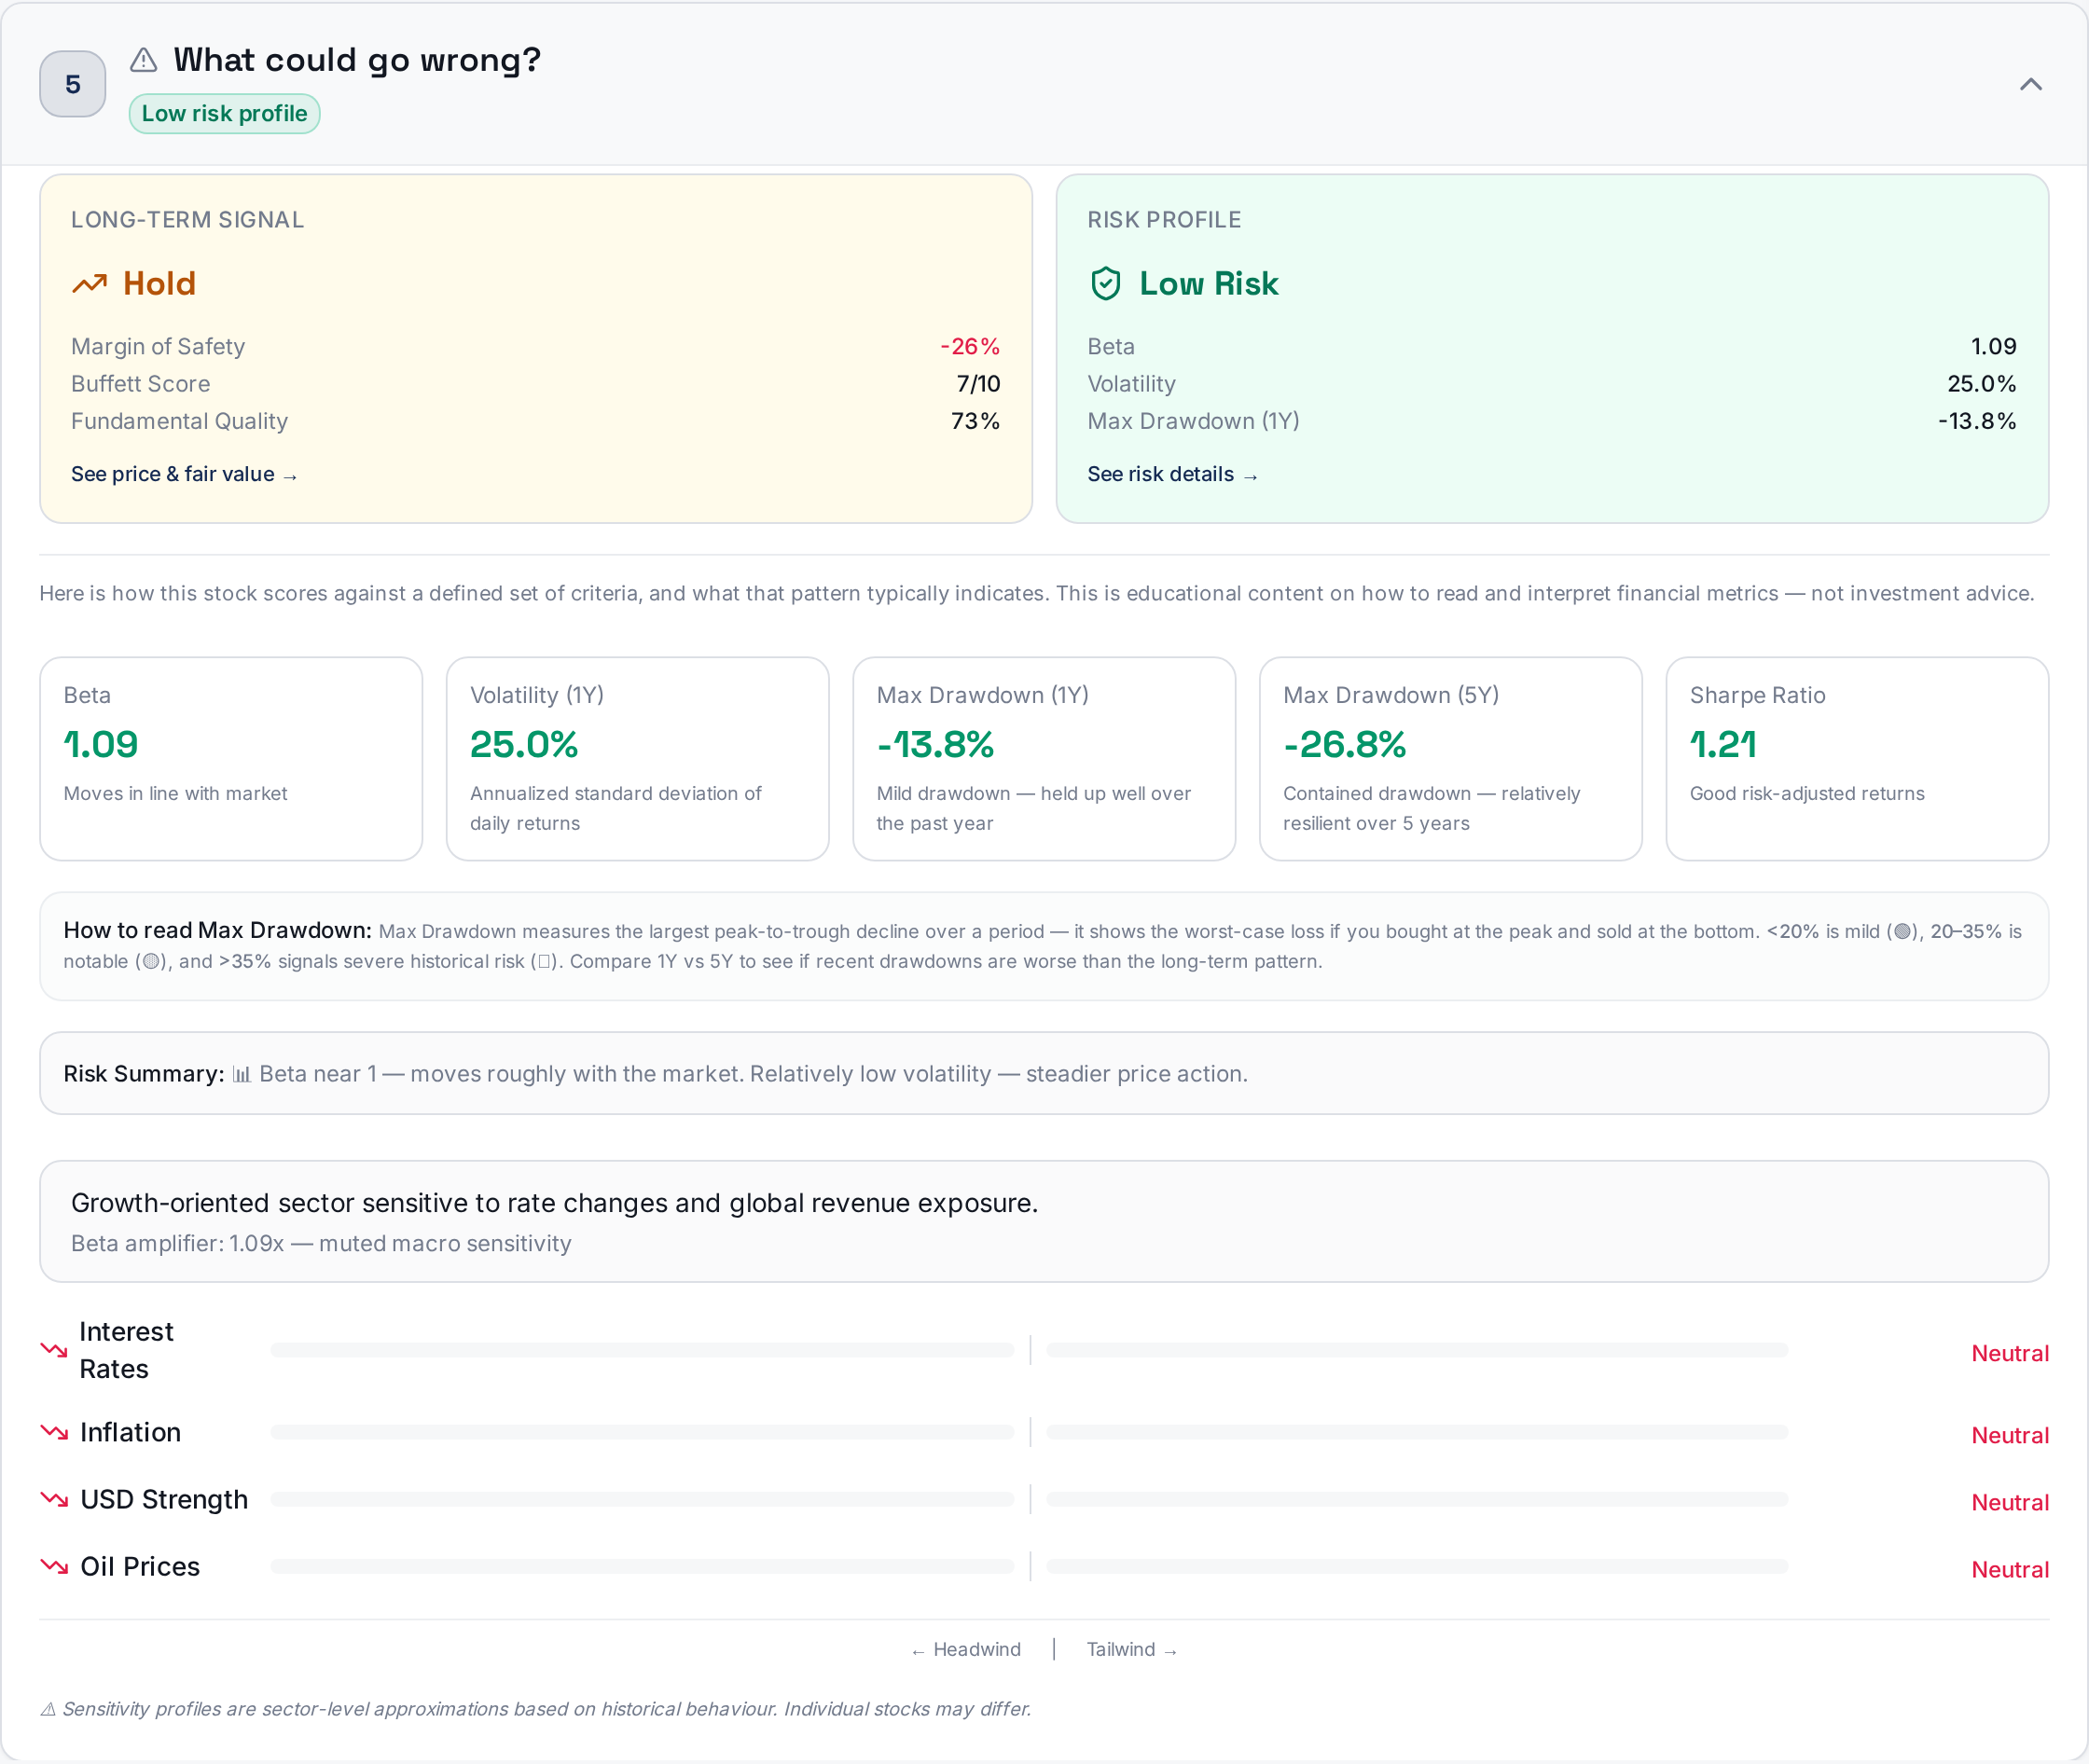
What could go wrong? — risk metrics and macro sensitivity.
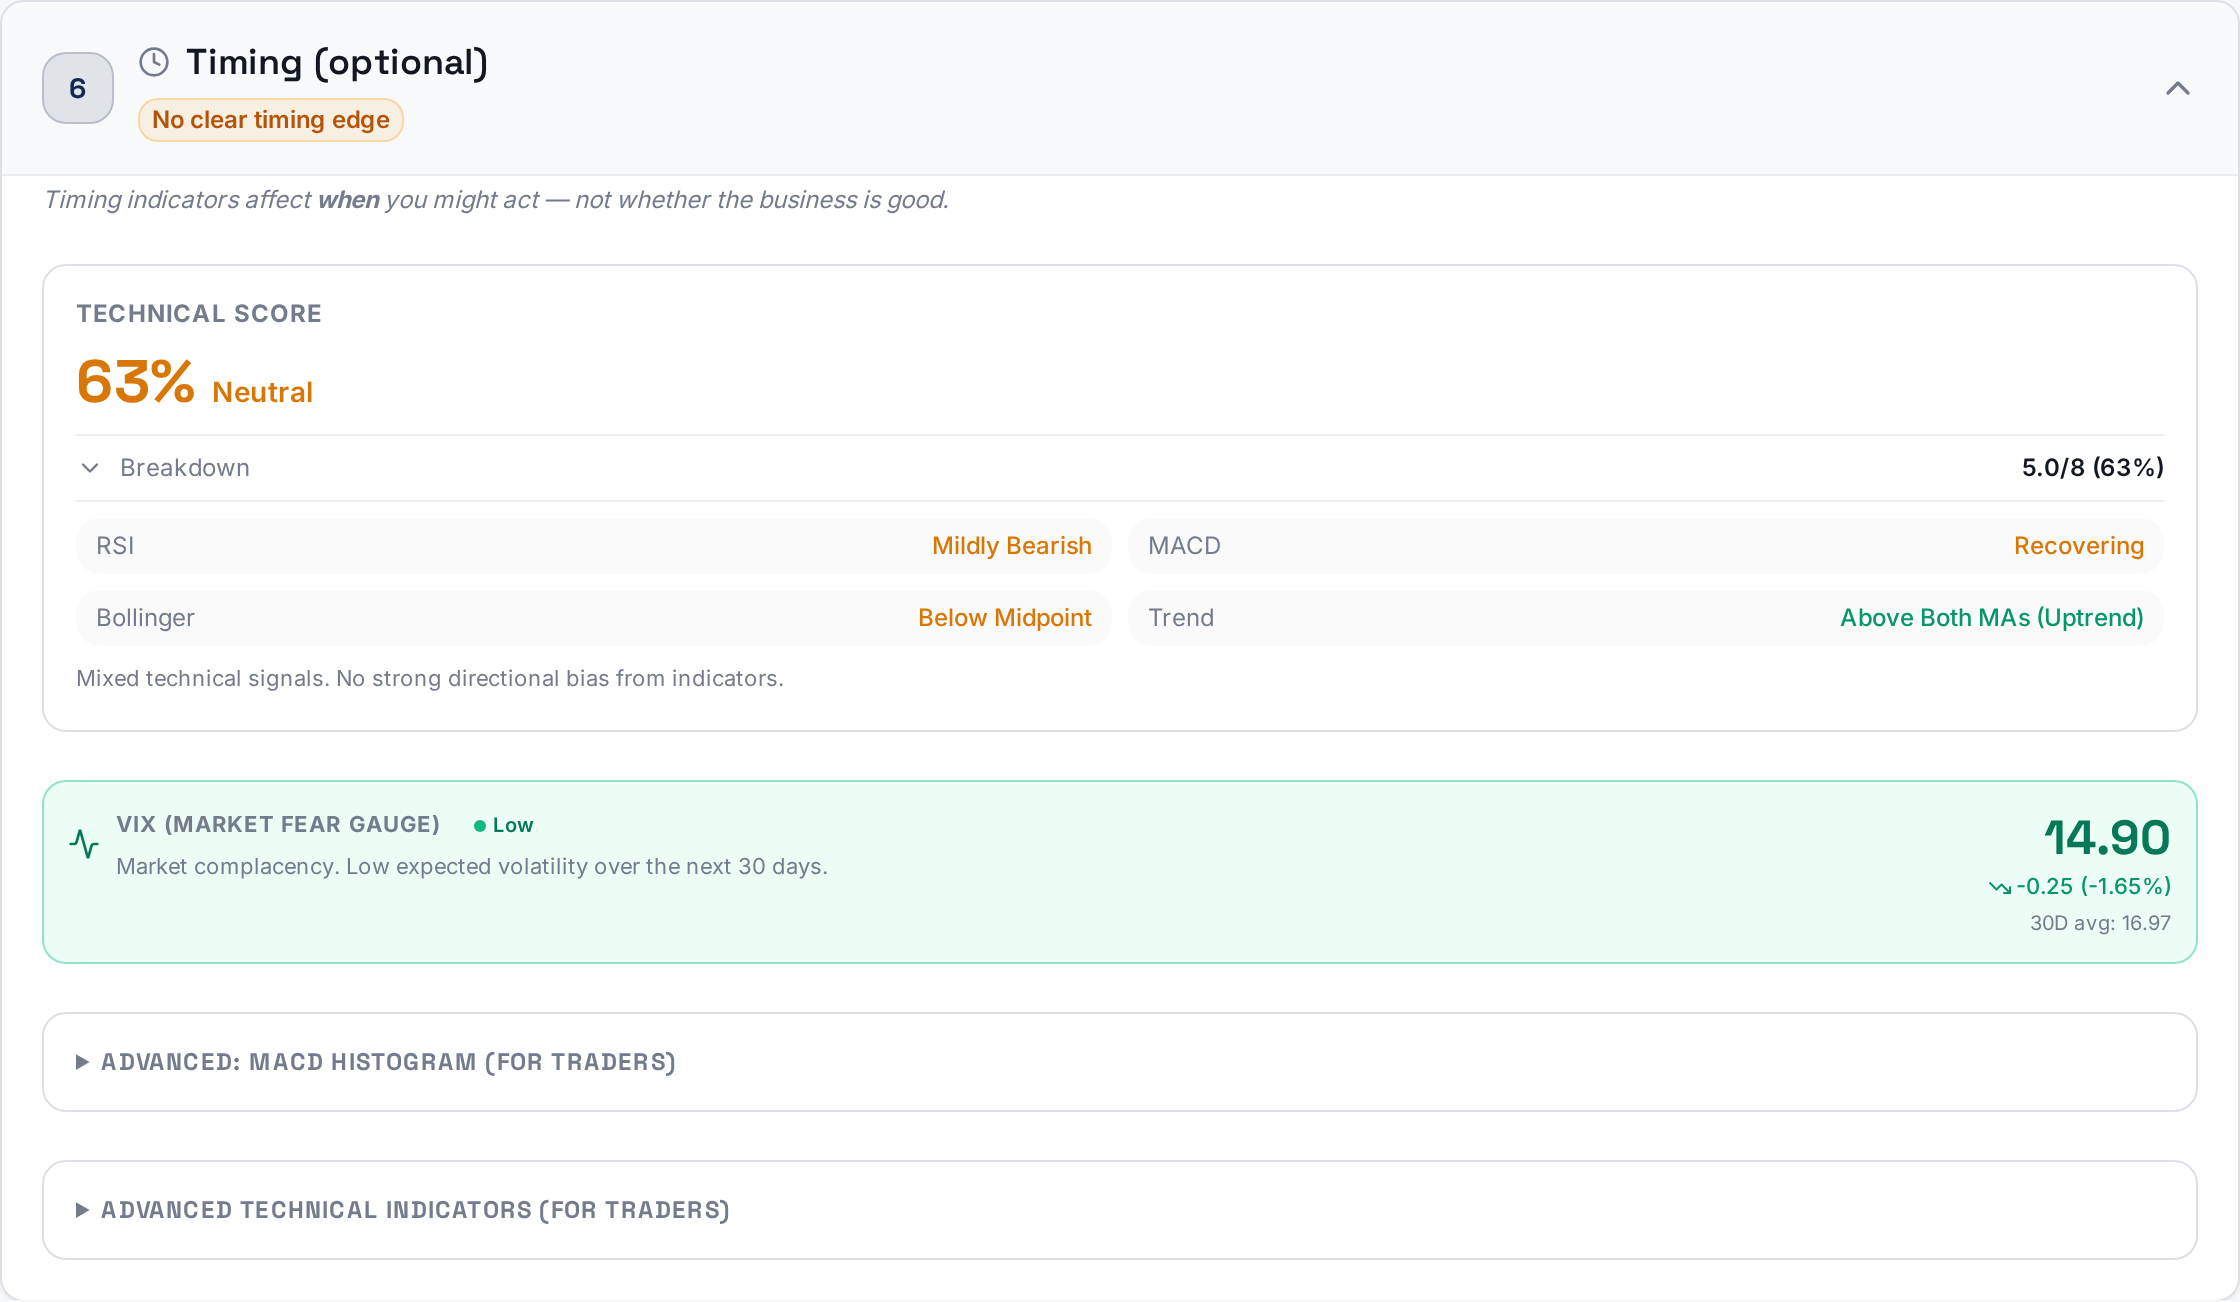
Timing (optional) — technical timing signals; affects when you might act, not whether the business is good.
More detail — income statement, insider activity, news.
Position Review — a cost-basis-agnostic review for a stock you already own.
Section 1 — What does this company do?
A short plain-English description of what the company sells and how it makes money.
You can't judge a business you can't describe, so the report opens with a plain-language summary of the company, its sector and industry.
Section 2 — Is it a good business?
Quality score, moat rating and the underlying checks.
Section 3 — Is it growing, and what's ahead?
Revenue and EPS estimates, growth momentum, estimate revisions and the next earnings date.
Section 4 — Is the price fair?
Analyst target, fair-value build-up, key multiples, scenarios and sector-relative comparison.
Section 5 — What could go wrong?
Beta, volatility, drawdowns, Sharpe ratio and macro sensitivity.
Section 6 — Timing (optional)
Technical score, trend, RSI, MACD and Bollinger position — for when to act, not whether the business is good.
Understanding the Scores
Quality Score (Business Quality)
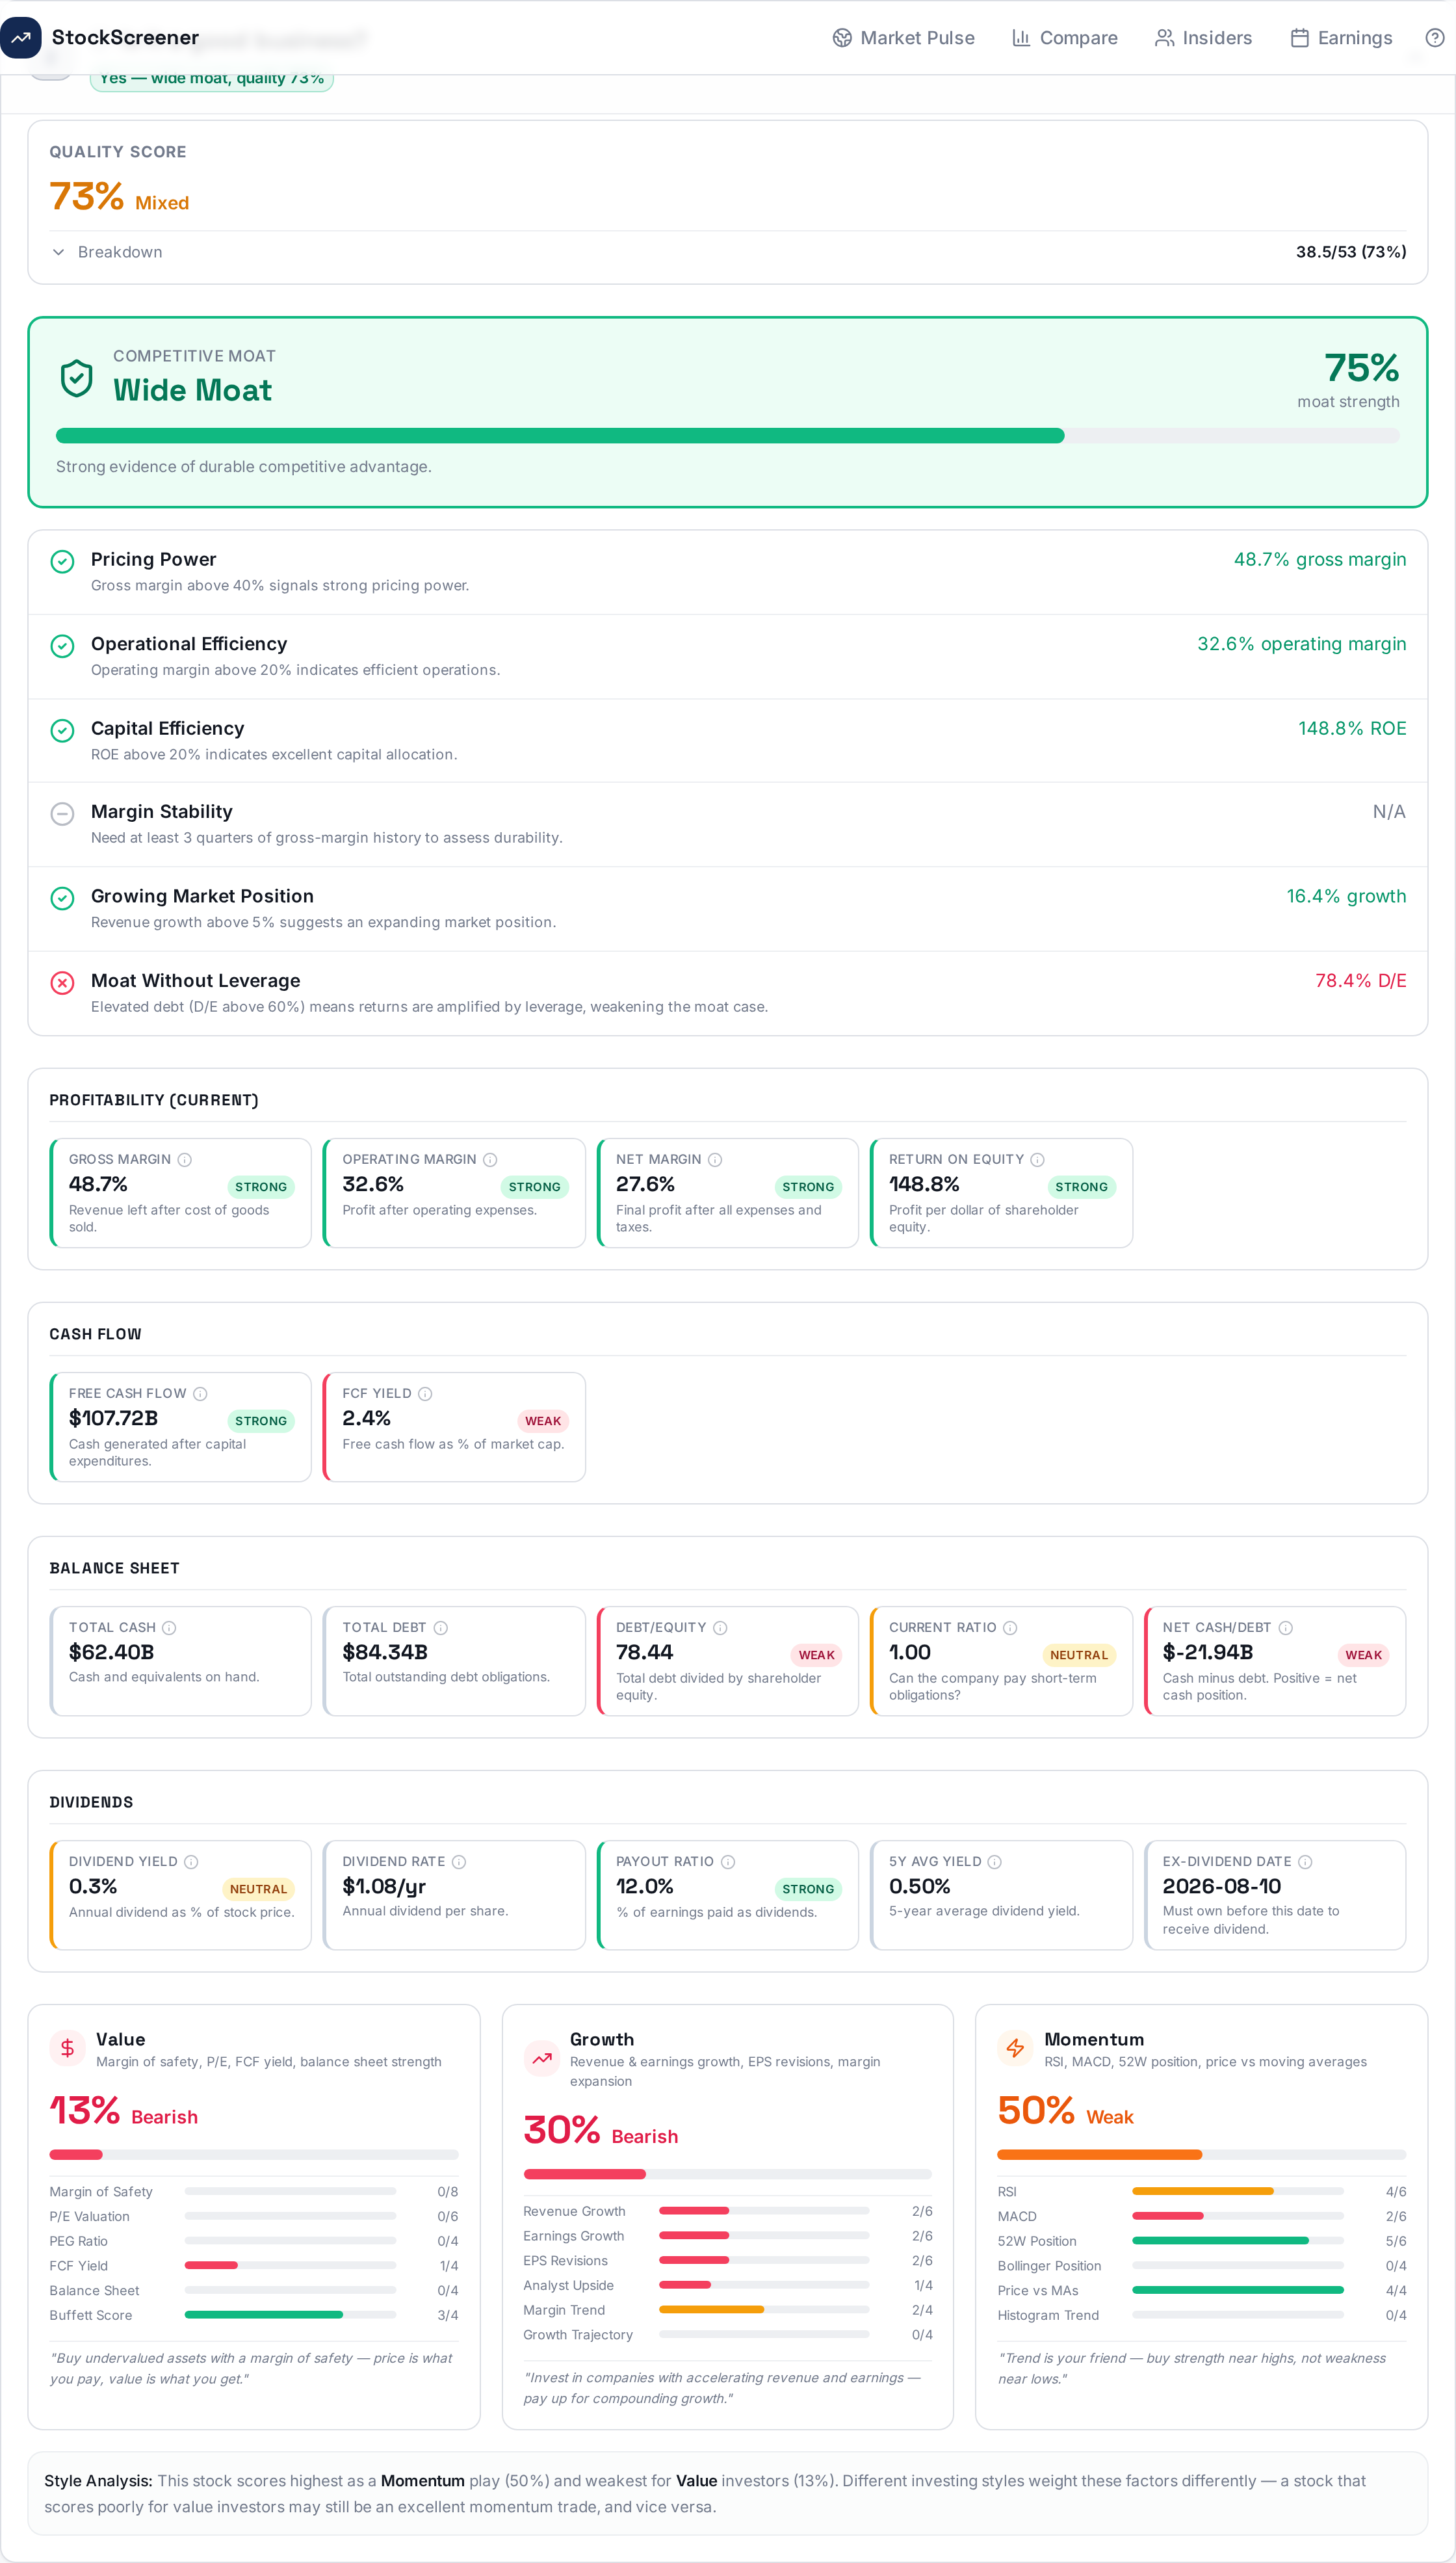
This answers: "Is this a good business?" — and deliberately excludes valuation, so a great company is never marked down on quality just for being expensive. Whether the price is fair is a separate question (see "Is the price fair?").
It looks at profitability and margins, cash generation, balance-sheet strength, growth durability and the moat.
A high score (70%+, labelled Strong) means the business itself looks high quality.
The report also shows a short plain-English read — the standout strengths and the main caveat — so the score is explained, not just shown.
A low score doesn't mean it's a bad company — it might just have one weak area (e.g. a leveraged balance sheet) dragging an otherwise strong business.
Technical Score (Price Momentum)
This answers: "Is the stock price trending up or down right now?"
It uses math-based indicators (like RSI, MACD, and moving averages) that track price patterns.
A high score means the price has been going up with strength.
A low score means the price has been weak or falling.
Key idea: A great business (high quality score) can still have a falling stock price (low technical score), and vice versa. Both matter.
The Investment Decision Panel
Long-Term Signal (50-Point Model)
This combines ten weighted factors into one verdict. Every stock is scored with these same weights:
Factor
Max Points
What It Measures
Analyst View
8
Wall Street consensus recommendation and upside to target
Margin of Safety
6
How far below our fair-value estimate the stock trades
Fundamental Quality
6
Business quality — profitability, cash flow, balance sheet
EPS Revisions
6
Whether analysts are raising or lowering estimates (defaults to 3/6 if unavailable)
Contrarian / Opportunity
5
Quality stocks trading near 52-week lows (mean-reversion signal)
Earnings Growth
4
Expected forward earnings growth rate
Revenue Growth
4
Expected forward revenue growth rate
Balance Sheet Health
4
Debt levels and financial stability
Technical Momentum
4
Price recovery trends and momentum signals
Growth-Adjusted P/E
3
PEG-based valuation relative to growth
The final signal is based on the percentage of total points earned:
Buy — Score ≥ 60%: The models think the stock is undervalued and the business is solid.
Hold — Score 35–60%: Fairly priced; no strong reason to buy or sell.
Sell — Score < 35%: The models flag it as overvalued or risky.
Why the Contrarian & Momentum factors? During broad market downturns, many fundamentally strong stocks get punished. These factors help the model recognize quality-at-a-discount opportunities rather than blindly downgrading everything that has dropped in price.
Elevated Risk — Some volatility; expect occasional drops.
High Risk — The price can move dramatically up or down.
A stock labeled "Buy (High Risk)" means: "This could be a good deal, but be prepared for a rough ride."
Plain-Language Verdict
The Verdict Panel at the top of the report gives one plain-English headline (a Buy / Hold / Sell framing), followed by colour-coded highlights and the grounded reasons that actually drove the signal — each carrying its points score, so the words always match the numbers.
You don't need to expand anything to get the full story: each of the report's question sections shows a one-line answer right in its header (for example, "Is it a good business? → A high-quality business (72%, wide moat)"). Read the eight headers top to bottom and you have the whole picture.
AI Summary
An AI-generated narrative summary that synthesizes the key findings from the report. It highlights the most important signals, valuation insights, and risks in plain English.
Report layout: Sections are ordered as a narrative — price & chart → verdict → 1. What does this company do? → 2. Is it a good business? → 3. Is it growing? → 4. Is the price fair? → 5. What could go wrong? → 6. Timing (optional) → 7. More detail → 8. Position Review. Every section header shows its one-line answer, so you can read the whole story without expanding anything.
Growth Momentum
Shows recent trends in revenue growth and profit margins:
Revenue Acceleration — Is growth speeding up or slowing down quarter over quarter?
Margin Expansion — Are gross and operating margins improving or contracting?
Accelerating revenue and expanding margins are powerful bullish signals.
Valuation & Scenarios
Current Price & Fair Value
The current stock price is prominently displayed alongside the composite fair value estimate. The fair value blends three models:
P/E Fair Value — Based on the stock's 5-year average P/E ratio.
Forward Fair Value — Based on expected future earnings and sector-appropriate multiples.
DCF Fair Value — Discounted cash flow model estimating intrinsic value from projected free cash flows.
Margin of Safety
Value
What It Means
Positive (+20%)
The stock costs less than what models think it's worth. Potential bargain.
Negative (-15%)
The stock costs more than the estimate. You'd be paying a premium.
Analyst Targets & Price Estimates
Shows the current price alongside analyst consensus targets (low, mean, high) and projected price estimates for the next 1–2 years based on earnings growth rates.
Scenario Analysis (Bull / Base / Bear)
Scenario
What It Means
Bull Case 🟢
Everything goes right — strong growth, market loves it. This is the optimistic price target.
Base Case 🟡
Things go roughly as expected. This is the most likely outcome.
Bear Case 🔴
Things go wrong — earnings disappoint, market drops. This is the pessimistic price target.
The bar at the top shows where the current price sits relative to these three scenarios.
Quality & Style Analysis
Style Scores
These tell you what kind of stock this is:
Value — Is it cheap compared to what it earns? High value scores mean you might be getting a bargain.
Growth — Is the company growing fast? High growth scores mean revenue and earnings are expanding quickly.
Momentum — Is the price trending upward right now? High momentum means the stock has been on a winning streak.
Buffett Checklist
Inspired by Warren Buffett. It checks things like:
Does the company have a competitive advantage (a "moat")?
Is management trustworthy (are insiders buying their own stock)?
Is the debt manageable?
Are earnings growing consistently?
A score of 8/10+ means Buffett would probably give it a thumbs up.
Moat Analysis
Definition: a "moat" is a durable competitive advantage that lets a company defend its profits from competitors over many years - a trusted brand, pricing power, high switching costs, scale advantages, network effects or unique assets. The wider the moat, the longer high returns are likely to last, which supports a higher fair value.
The app scores the moat from hard numbers, not opinion:
Full-weight (durability) factors: gross margin (pricing power), operating margin, return on equity, and margin stability.
Half-weight (tie-breaker) factors: revenue growth and debt-to-equity.
Factors with no data are excluded from the total rather than counted as a fail.
The percentage shown is points earned divided by points available:
Wide — 70% or more: strong evidence of a durable advantage.
Narrow — 40–69%: some advantages, but they may not be fully durable.
None — below 40%: little protection from competition.
Because durability is weighted above growth, mature compounders such as Coca-Cola score Wide even with slow revenue growth, while fast-growing but lower-margin, more cyclical names typically land in Narrow.
Risk & Context
Risk Metrics — Beta, volatility, max drawdown, Sharpe ratio.
Relative Comparison — Compares the stock's key metrics against sector medians.
Macro Sensitivity — How much the overall economy affects this stock.
Each score card has a collapsible breakdown showing every factor with points earned vs. maximum. Hover over any factor name to see a tooltip explaining what that indicator measures.
Green bar — Strong (66%+ of points earned)
Yellow bar — Moderate (33–66%)
Red bar — Weak (below 33%)
Technical Snapshot
Located under the Technical Score, this grid shows four indicators at a glance:
RSI — Overbought (above 70) or oversold (below 30)?
MACD — Momentum accelerating or fading?
Bollinger — Price near the top or bottom of its normal range?
Trend — Moving averages aligned in an uptrend or downtrend?
EPS Revision Trends
Tracks how analyst earnings estimates have changed over the past 7, 30, and 90 days. Upward revisions are bullish; downward revisions are bearish. This is one of the most predictive leading indicators.
Market Activity
Recent News — Latest headlines with links to full articles.
Insider Activity — Whether company executives are buying or selling shares.
Position Review — Should I Sell?
Designed for stocks you already own. It checks nine data points — including EPS revisions, insider selling, fundamental scores, and margin trends — and flags Red Flags or Caution items. The assessment ignores your cost basis on purpose: what you paid doesn't change whether the business is still worth holding.
ETF Analysis
When you search for an ETF (like SPY, QQQ, VOO, or IBIT), the tool automatically detects it and loads a specialized ETF report instead of a stock report.
ETF Quality Score
Similar to the stock's fundamental score, but tailored for funds. It evaluates:
Expense Ratio — The annual cost of owning the ETF. Lower is better.
Tracking Error — How closely the ETF follows its benchmark. Lower is better.
AUM (Assets Under Management) — Larger funds tend to be more liquid and stable.
Performance vs. Category — How the fund compares to its peer group.
Risk-Adjusted Returns — Sharpe ratio, alpha, and other risk metrics.
ETF Technical Score
Uses the same RSI, MACD, Bollinger, and Trend indicators as stocks. Includes a full technical snapshot and MACD chart.
Key Metrics
At-a-glance metrics with tooltips: Expense Ratio, AUM, Yield, Beta, Turnover Rate, and Tracking Error.
Peer Comparison
Automatically finds similar ETFs in the same category and compares them side by side on:
Expense ratio (lowest highlighted in green)
1-year and 3-year returns
Sharpe ratio (best highlighted in green)
Yield and AUM
Your selected ETF is highlighted with a YOU tag so you can quickly see how it stacks up.
Performance
Annualized returns across multiple time periods (YTD, 1Y, 3Y, 5Y, 10Y) with comparison to the category average when available. Also includes a historical annual returns grid.
Holdings & Allocation
Top 10 Holdings — The biggest positions in the fund, with percentage weights.
Sector Allocation — Visual bar chart showing sector breakdown.
Asset Allocation — Split between stocks, bonds, and cash.
Concentration Label — Whether the fund is broadly diversified or heavily concentrated.
Risk Analysis
Comprehensive risk metrics including Sharpe Ratio, Alpha, R-Squared, Standard Deviation, Volatility, Max Drawdown (1Y and 5Y), and Treynor Ratio — each with tooltips explaining what they mean.
Fund Flow Estimate
An estimated trend (inflows vs. outflows) based on AUM changes, recent returns, and market conditions. Note: this is an estimate, not actual flow data.
AI Summary for ETFs
Just like stocks, ETFs get an AI-generated narrative summary that highlights the fund's strengths, weaknesses, cost efficiency, and how it compares to alternatives.
Compare
Open Compare from the header (or the form on the home page) and enter up to six tickers to see them side by side.
Side-by-side table across price, targets, valuation, growth, balance sheet and returns.
Columns include price and 52-week range, analyst targets (low / mean / high), trailing and forward P/E, PEG, estimated revenue and earnings growth, total cash, total debt, debt-to-equity, price/book and ROE. Use it to shortlist which names deserve a full report.
Market Pulse
Macro snapshot with an explicit "updated" timestamp and data cutoff window.
Macro snapshot — rates, inflation, growth and market backdrop, refreshed against a recent cutoff window so the numbers are not stale.
Sector rotation — which sectors money is moving into and out of.
Hedge fund positioning — themes visible in recent 13F filings.
Buying the dip — names where sentiment has fallen faster than fundamentals.
Analyst changes, unusual options and index changes — short-term catalysts worth knowing about.
Market Pulse content is AI-assembled from public sources. Always confirm a specific number before acting on it.
Insider Scanner
Market-wide insider buys, sells and cluster trades from the last 60 days.
The scanner covers a wide universe of tickers and filters out anything older than 60 days, so the list keeps moving. Cluster buys — several insiders buying in the same window — carry the strongest signal, because routine option exercises and scheduled sales are de-weighted. Click any ticker to open a detail view with the transaction timeline and links to SEC EDGAR filings.
Earnings Calendar
Access it via the "Earnings Calendar" button in the header. This page shows upcoming quarterly earnings reports for ~50 of the biggest public companies.
Upcoming reports grouped by week, with countdowns and AI "What to Watch" briefs.
What You'll See
Earnings Date — When the company reports, with a live countdown timer.
Consensus EPS Estimate — What analysts expect the company to earn per share.
Revenue Estimate — Expected total revenue.
Forward P/E — Price-to-earnings ratio based on future expected earnings.
Last Quarter's EPS Surprise — Whether the company beat or missed estimates last time.
Countdown Timers
Each card shows how many days until the earnings report. Color coding helps you spot urgency:
Today / Tomorrow — Reporting imminently.
Within 7 days — Coming up soon.
Grey — More than a week away.
Month Filters & Weekly Grouping
Use the month buttons at the top to filter by reporting month. Earnings are grouped by week for easy scanning.
What to Watch (AI-Powered)
Click "What to Watch" on any company card to expand an AI-generated preview. This includes:
Key Metric — The single most important number to watch this quarter.
Catalysts — Specific positive drivers analysts are focused on.
Risks — Specific concerns or headwinds to be aware of.
Analyst Sentiment — A brief summary of the consensus mood.
This analysis is generated on-demand for each company using current market context, so it stays relevant and specific.
🎯 Key Things to Remember
No tool can predict the future. This gives you probabilities and analysis, not guarantees.
Don't rely on one number. Look at the full picture — scores, valuation, risk, and news together.
High return = High risk. Stocks that could double can also lose half their value.
Time matters. The long-term signal is for investors thinking in years, not days.
Stocks vs. ETFs. ETFs spread risk across many holdings; individual stocks carry company-specific risk.
Always do your own research. Use this as a starting point, not the final answer.
📋 Quick Cheat Sheet — Stocks
You See
It Means
Quality Score 70%+
Strong, high-quality business
Technical Score 75%+
Price is trending up with strength
Analyst target +15% or more
Wall Street sees meaningful upside over 12 months
Fair-value estimate +25%
Trading well below our model's intrinsic estimate
Fair-value estimate -20%
Trading above our model's estimate — paying a premium
Bull Case +50% upside
Big potential if things go well
Bear Case -30% downside
Significant risk if things go wrong
Buffett Score 8/10
Passes most quality checks
Insider Net Buying
Management is putting their own money in
High Risk label
Expect big price swings
Contrarian factor scoring high
Quality stock at a discount — potential recovery play
📋 Quick Cheat Sheet — ETFs
You See
It Means
Expense Ratio < 0.10%
Very low cost — more of your money stays invested
Expense Ratio > 0.50%
Relatively expensive — compare with cheaper alternatives
Top 10 Weight > 50%
Concentrated fund — performance depends on a few stocks
Sharpe Ratio > 1.0
Strong risk-adjusted returns
Tracking Error < 0.5%
Closely tracks its benchmark index
Peer highlighted in green
Best-in-class for that metric among similar funds
Estimated inflows
Money flowing into the fund — positive investor sentiment
Investing is a skill that improves with practice and patience. The best investors aren't the ones who find the "perfect stock" — they're the ones who consistently make well-informed decisions over time.